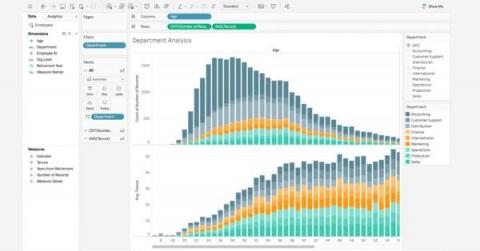
A look at best practices, no-code and low-code platforms you can use, common visualization types, criteria for good data visualization and more. Organizations regularly generate an overabundance of data that is essential for decision-making. Data visualizations play an important role in helping people understand complex data and observe patterns and trends over a period of time.
Modern computing environments and distributed workforces have produced new challenges to traditional information security approaches. Many traditional threat detection and response strategies rely on homogeneous environments, system baselines, and consistent control implementations. These strategies have been built on traditional environment assumptions that may no longer be true in your environment with the evolution of cloud computing, remote work, and modern culture.
Elastic has an entirely new Heartbeat/Synthetics workflow superior to the current workflow. If you’re a current user of the Elastic Uptime app, read on to learn about the improved workflow you can use today and should eventually migrate toward.
In my last blog I took a look at some of what I see as the most obvious signs that your MSP business might have outgrown its RMM. These included: In this blog, I’m going to turn my attention to looking at some of the less obvious signs to reconsider your RMM.