
Operations | Monitoring | ITSM | DevOps | Cloud

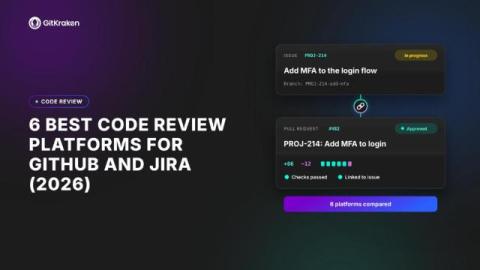
6 Best Code Review Platforms for GitHub and Jira (2026)

Your team runs on GitHub for code and Jira for planning. But when it comes to code review tools, those two worlds rarely talk to each other. Pull requests pile up on one side while issues stall on the other, and reviewers lose time switching between tabs to piece together context. GitKraken gives you a connected code review workflow that bridges GitHub and Jira, so your team spends less time chasing context and more time shipping.
Conductor is joining Meta. What that means if you run parallel agents

On November 4, Conductor announced it’s joining Meta. If you run your agents in Conductor, you probably saw the post that morning. I know I saw it when my coworkers started sharing the link in Slack. If Conductor was your main tool, this kind of sucks. You didn’t plan to go shopping for a new one this month, and 2 weeks to get off Cloud is pretty tight, especially if you built scripts around it.

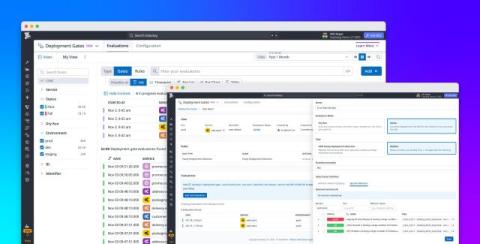
Catch incidents and pause faulty deployments automatically with Datadog Deployment Gates

As AI-assisted development helps teams create and ship more code, engineers need to check a growing volume of changes under real production conditions. Even code that passes testing can introduce errors or slowdowns in production, so early detection is essential to protecting customers. Automating those health checks helps teams keep pace by reducing the time engineers spend watching dashboards.

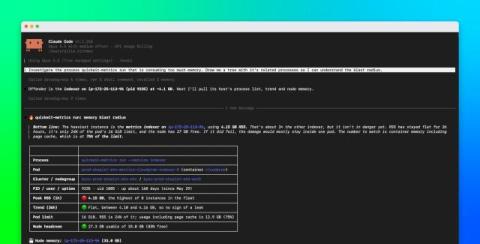
Investigate Kubernetes health and processes with the Datadog MCP Server

When investigating issues with a Kubernetes service, SREs and platform engineers need to understand what’s happening across its supporting infrastructure. For example, is a process still running? Did it restart? Is the scheduler struggling to place pods? Finding the answers to these questions often requires engineers to search process inventories, examine resource metrics, and query Kubernetes control plane telemetry.

Run cost-effective, always-on agents to monitor your environment: the engineering behind Watchers

Alert rules are great for the failures you can predict, but they fall short on the ones you can't. With the advent of modern AI, you might think the solution is to swarm your stack with agents that monitor every last detail, but that can quickly lead to astronomical bills. And those are the gaps Watchers fill: catching what alerts miss while keeping costs in control. Generally Available as of ObservabilityCON 2026, Watchers are always-on agents in Grafana Assistant.

How a broken release name overloaded our symbolication database

When a JavaScript error reaches Sentry, the stack trace points at minified code. Sentry finds the source map that was uploaded for that build to be able to show you the original file and line. Source maps are uploaded in artifact bundles. There are two ways to find the right one: Symbolicator, our open-source symbolication service, does the lookup when it processes an event.

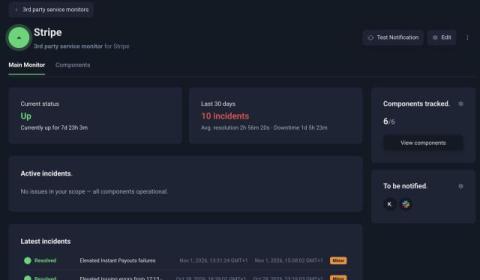
Third party service monitoring is now in the API, MCP and CLI.

We’re happy to announce that you can set up Third party service monitoring from the UptimeRobot API, MCP server and CLI too, and get alerted when a service your product depends on has an outage. Add a provider from your deploy pipeline, ask your AI assistant whether Stripe had an incident last night, or check a provider’s status from your terminal.

The Top 12+ Open Source Monitoring Tools in 2026.

Open source website monitoring tools give organizations greater control over how they monitor websites, servers, applications, and infrastructure. They can reduce licensing costs, offer extensive customization, and integrate with existing workflows, but they also require more time to deploy, maintain, and scale than managed alternatives. We’ll compare some of the best open source website monitoring tools available today, from lightweight uptime monitors to enterprise-grade observability platforms.

8 Best On-Call Scheduling Tools for IT Operations in 2027

IT operations teams need more than a shared calendar to manage after-hours incidents. When a server goes down, a network fails, or a critical application becomes unavailable, the right technician needs to be notified immediately. However, managing on-call coverage through spreadsheets, manual call trees, and disconnected notification systems can create gaps in coverage, missed alerts, and delayed incident response.