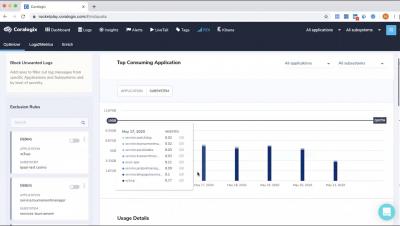
Quota Optimizer
Coralogix shows which environments are consuming the majority of your log quota so that you can reduce monitoring costs and avoid retention of unnecessary logs.


The latest News and Information on Log Management, Log Analytics and related technologies.
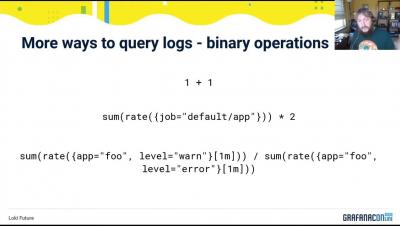
GrafanaCONline is live! We hope you’re able to check out all of our great online sessions. If you aren’t up-to-date on the presentations, here’s what you missed on day 7 of the conference.
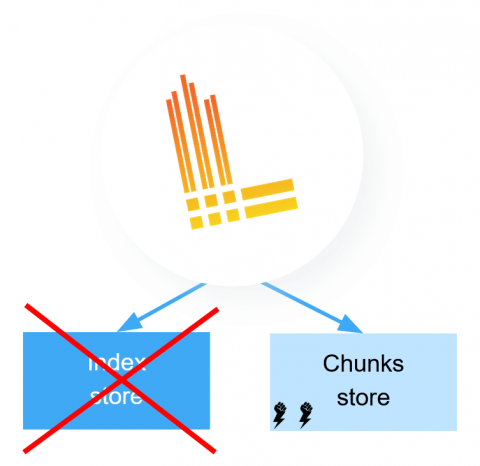
Today we released version 1.5.0 of Loki! This release comes with some really exciting news and a little bit of caution if you operate Loki installations.
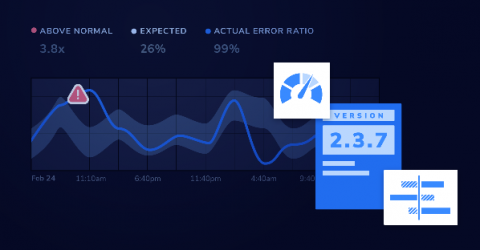
DevOps monitoring didn’t simply become part of the collective engineering consciousness. It was built, brick by brick, by practices that have continued to grow and flourish with each new technological innovation. Have you ever been forced to sit back in your chair, your phone buzzing incessantly, SSH windows and half-written commands dashing across your screen, and admit that you’re completely stumped? Nothing is behaving as it should and your investigations have been utterly fruitless.
Application performance monitoring (APM) and logging both provide critical insight into your ecosystem. When paired together with context, they can provide vital clues on how to resolve problems with your applications. As the log data you analyze becomes more complex, navigating to the relevant pieces can be tricky using traditional tools. With Elastic Observability (powered by the Elastic Stack), correlating logs with APM is as simple as a few clicks in Kibana.
Today we are officially releasing Graylog v3.3 This release includes enhancements to search, events, and alerts that introduce greater efficiencies to your daily log management efforts and strengthen your audit and compliance capabilities. Please read on for detailed descriptions of each feature.
IDG’s recent “State of the CIO” survey across IT leaders has revealed the impact of COVID-19 on IT organizations and the sudden and unforeseen shifts of their initial 2020 plans.