Operations | Monitoring | ITSM | DevOps | Cloud

The latest News and Information on Log Management, Log Analytics and related technologies.

Observability vs. Monitoring - What's the Difference?

Some of the earliest memories of my career involve getting spammed by hundreds of emails from monitoring systems. After managing to find an issue, I’d scroll through endless logs trying to find obscure bugs that are impossible to recreate. I’m sure you’ve been there. I’ve spent many hours, days, and even weeks pressing “Page Down” on my keyboard trying to find a clue pointing me toward the root cause. I’m here to tell you: there’s a better way.


Elastic 7.11 released: General availability of searchable snapshots and the new cold tier, and the beta of schema on read

We are pleased to announce the general availability (GA) of Elastic 7.11. This release brings a broad set of new capabilities to our Elastic Enterprise Search, Observability, and Security solutions, which are built into the Elastic Stack — Elasticsearch and Kibana. This release enables customers to optimize for cost, performance, insight, and flexibility with the general availability of searchable snapshots and the beta of schema on read.

DoD's Cyber Posture: A Focus on Automation

The importance of the security of the Department of Defense’s (DoD’s) networks is no secret (well, of course a lot of it is secret!). This is evidenced by the Department’s IT/cybersecurity budget request that annually tops $40 billion dollars. Last year’s IT and Cyberspace Activities Budget Overview perhaps said it best.

10 Ways to Implement Effective IoT Log Management

The Internet of Things (IoT) has quickly become a huge part of how people live, communicate and do business. All kinds of everyday things make up this network – fridges, kettles, light switches – you name it. If it’s connected to WiFi, it’s part of the Internet of Things. IoT raises significant challenges that could stand in your way of fully realizing its potential benefits.

Log4j Tutorial: How to Configure the Logger for Efficient Java Application Logging

Getting visibility into your application is crucial when running your code in production. What do we mean by visibility? Primarily things like application performance via metrics, application health, and availability, its logs should you need to troubleshoot it, or its traces if you need to figure out what makes it slow and how to make it faster. Metrics give you information about the performance of each of the elements of your infrastructure.

Ringing In the New Year With Splunk and Microsoft: Three New Integrations

Like champagne and party hats, Splunk and Microsoft just go together. Here at Splunk, one of our New Year’s resolutions is to continue to empower our customers with data — in this case, Microsoft data. From cloud, to security, to troubleshooting, we’re back with the latest round of new integrations designed to help you do more with Splunk and Microsoft.

Breaking the Logjam of Log Analytics

To understand the value of logs—those many digital records of hardware and software events—picture a big puzzle. You put all the pieces together to make sense of them. Every day the modern enterprise generates billions of logs, each capturing a user log-in, application record change, network service interruption—as well as the messages these entities send to one another.

French Ministry of Armed Forces picks Elastic Cloud to fight COVID-19 and future pandemics

WaKED-CO (Watch of Knowledge on Emergent Diseases COVID-19) is an initiative launched in record time — deployed just a month after developing a prototype — under the leadership of the health service within the Ministry of Armed Forces in France. The project had one core mission: to make it easier to research the literature around the COVID-19 crisis.

Visual Link Analysis with Splunk: Part 3 - Tying Up Loose Ends

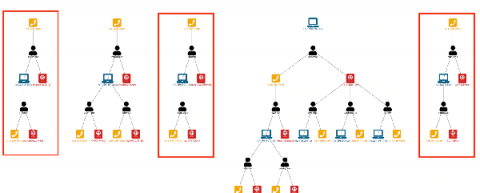
In my previous Link Analysis blogs, "Visual Link Analysis with Splunk: Part 1 - Data Reduction" and "Visual Link Analysis with Splunk: Part 2 - The Visual Part," I used techniques that work well when we have a controlled data set. However, as we know, real data can be messy. When analyzing links in fraud data, the data can be very noisy. Let’s say we want to use IP addresses for link analysis in the Splunk platform. It is not unusual for two people to share an IP address.

Monitoring your Web Application on Apache with Logz.io

These days, more and more web applications are developed and refined to keep the customer engagement at the highest level possible. It is crucial to provide a smooth experience to the customer hence monitoring is of paramount importance. One key factor in that is monitoring the web server we use. In this article, we will explore Logz.io features by monitoring an Apache Web Server.