The latest News and Information on Monitoring for Websites, Applications, APIs, Infrastructure, and other technologies.
If you are familiar with instrumenting applications, you may have heard of OpenMetrics, OpenTracing, and OpenCensus. These projects aim to create standards for application performance monitoring and collecting metric data. Although the projects do overlap in terms of their goals, they each take a different approach to observability and instrumentation.
Because Ruby is an object-oriented language, we tend to model the world as a set of objects. We say that two integers (x and y) are a Point, and a Line has two of them. While this approach is often useful, it has one big problem. It privileges one interpretation of the data over all others. It assumes that x, and y will always be a Point and that you'll never need them to act as a Cell or Vector. What happens when you do need a Cell? Well, Point owns the data. So you add a your cell methods to Point.
Creating a website from scratch requires a lot of work, which is often tedious. In several cases, you will need to recreate the functionalities that you have built thousands of times. This recreation of functions is equal to reinventing the wheel. This is where software frameworks come handy, you can utilize such frameworks as the foundation for you application and build your program upon it.
More than likely you’re here because you’ve made the leap or are thinking of making the leap in investing in a Real Monitoring Solution. Congrats. You’re one step closer to having the power of user metrics working in your favor. Real User Monitoring is a way for your users to communicate with you how satisfied they were when they interacted with your website or webapp, so how can you be sure you’re listening correctly?
Internet Explorer 11 is an updated version of the IE web browser developed by Microsoft. And if previous versions saw you move to other browsers, then this article will help you reconsider. The previous versions of Internet Explorer didn’t have a developer-friendly browser, but vast improvement can be seen in its latest version. The built-in developer tools in IE11 now make developing and debugging code in the browser a simple task.
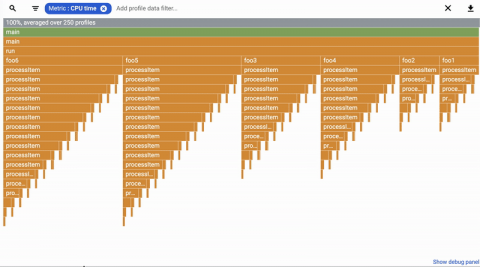
Historically, cloud developers have had limited visibility into the impact of their code changes. Profiling non-production deployments doesn’t yield useful results, and profiling tools used in production are typically expensive, with a performance impact that means that they can only be used briefly and on a small portion of the overall code base.
Bugs are dumb. They’re also inevitable. However annoying that may be, it’s more productive to accept the existence of bugs in our workflows than to panic-spiral every single time they pop up. Part of the acceptance process is keeping bugs (or at least the ones you care to fix) top of mind by paralleling your error monitoring and your sprint planning.