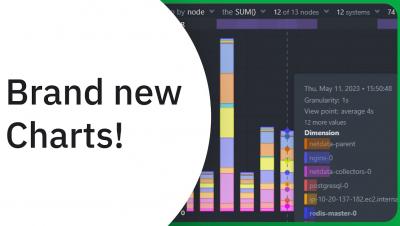
The menu (on the overview or single node tab) now has an anomaly rate button built into it that, for the entire visible window or a highlighted time range, shows the maximum chart anomaly rate within each section. Read on to learn more about this new feature!
I’m Jerrod, the Head of Codecov @ Sentry. I’d like to share updates from the first major release of our Codecov and Sentry integration and new Codecov pricing for Sentry customers.
A Recap of SRECon 2023 Americas by guest author Sebastian Vietz.
As enterprises grow bigger, more sophisticated, and more complex, it can be difficult to detect signs that network reliability is at risk. That’s why the ScienceLogic SL1 AIOps platform uses advanced, real-time analytics to track behavioral correlation and understand issues affecting infrastructure performance—and solve them quickly.