Operations | Monitoring | ITSM | DevOps | Cloud

The latest News and Information on Distributed Tracing and related technologies.

What Is Distributed Tracing?

Modern software development is evolving rapidly, and while the latest innovations allow companies to grow through greater efficiency, there is a cost. Modern architectures are incredibly complex, which can make it challenging to diagnose and rectify performance issues. Once these issues affect customer experience, the consequences can be costly. So, what is the solution? Observability — which provides a visible overview of the big picture.

Intro to distributed tracing with Tempo, OpenTelemetry, and Grafana Cloud

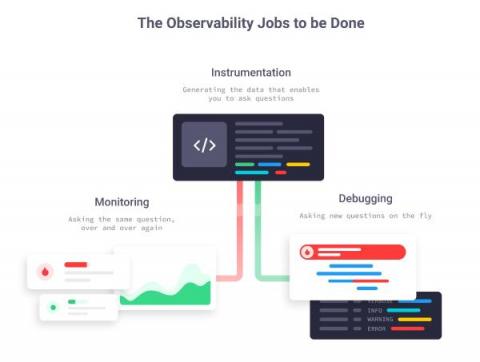
I’ve spent most of my career working with tech in various forms, and for the last ten years or so, I’ve focused a lot on building, maintaining, and operating robust, reliable systems. This has led me to put a lot of time into researching, evaluating, and implementing different solutions for automatic failure detection, monitoring, and more recently, observability. Before we get started: What is observability?

NodeJS Application Manual Instrumentation for Distributed Traces

In this blog series, we are covering application instrumentation steps for distributed tracing with OpenTelemetry standards across multiple languages. Earlier, we covered Java Application Manual Instrumentation for Distributed Traces, Golang Application Instrumentation for Distributed Traces, and DotNet Application Instrumentation for Distributed Traces. Here we are going to cover the instrumentation for NodeJS.

Using Jaeger for your microservices

Jaeger is a popular open-source tool used for distributed tracing in a microservice architecture. In a microservice architecture, a user request or transaction can travel across hundreds of services before serving what a user wants. Distributed tracing helps to track the performance of a transaction across multiple services. Before we deep dive into how Jaeger accomplishes distributed tracing for microservices-based architecture, let's take a short detour to understand distributed tracing.

observIQ Cloud and the OpenTelemetry Collector

Our log agent is powerful, efficient, and highly adaptable. Now, with OpenTelemetry setting new standards in the observability space, we wanted to incorporate that collaboration into our log agent and offer our users the ability to take advantage of the OpenTelemetry ecosystem. Starting today, you can upgrade the log agents in your observIQ account to the new Open Telemetry-based observIQ log agent with a single click.

How Refinery Helps With Sampling Complex Event Data

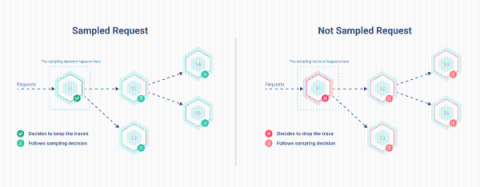
Sampling is the practice of extracting a subset of data from a dataset to make conclusions about that larger dataset. It’s far from a perfect solution, but when it’s implemented with Refinery, Honeycomb’s trace-aware sampling proxy, sampling can help you manage very high volumes of complex event data.

What Is Distributed Tracing and Why You Need It

It is no surprise that monitoring workloads are top of mind for many organizations to ensure a successful customer experience. As our applications become more distributed and cloud-native, we find that monitoring can become more complex. A single user transaction fans out to interact with tens or hundreds of microservices, each one requesting data from backend data stores or otherwise interacting with each other and other parts of your infrastructure.