The genesis of SigNoz - A full-stack open source observability platform
Why we felt there was a need for a full stack open source observability platform and how we went about building it.
The latest News and Information on Observabilty for complex systems and related technologies.
Why we felt there was a need for a full stack open source observability platform and how we went about building it.
Starting today, Honeycomb’s Management API is generally available to all Honeycomb users. The Honeycomb Management API is a set of endpoints that lets you programmatically set up, configure, and delete queries, datasets, derived columns, and more. With this release, you can now manage Honeycomb with configuration as code either directly via API or with third-party tools, like Terraform, using the community-contributed Honeycomb provider.
In a distributed IT environment, there are a lot of moving parts, and all of them need to be monitored to ensure everything is working as it should. The rise of more complex infrastructures interweaving the cloud, on-premises, and hybrid architectures makes this a challenge. To make sure you have adequate visibility, you need an IT observability strategy.
Sumo Logic is a cloud-based log management and analytics service that leverages machine-generated big data to deliver real-time IT insights. We’re excited to share that you can now easily integrate Catchpoint and Sumo Logic, giving you a number of fantastic benefits. The integration involves pushing data from Catchpoint to Sumo Logic using Webhooks and then query the data to build visualizations. Why do we use Webhooks?
Over the last few months, Honeycomb’s platform team migrated to a new iteration of our ingest pipeline for customer events. Our migration to this newer architecture did not go too smoothly, as can be attested by our status page since February. There were also many near-incidents where we got paged and reacted quickly enough to avoid major issues. We’ve decided to write a full overview of all the challenges we had encountered, which you can can download.
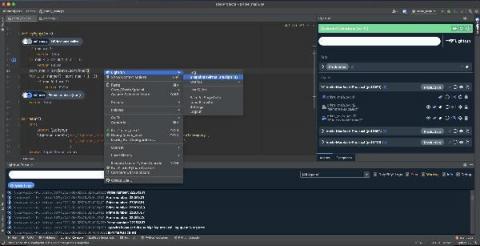
Lightrun, the continuous debugging and observability company, today announced the release of a free, self-service version of its popular debugging solution for developers. Lightrun Cloud is not only the most powerful debugger a developer can use to troubleshoot production applications live from within the IntelliJ IDE – but also the easiest to set-up, with a complete self-service experience that gets developers up and running in less than five minutes.
Why do organizations invest in observability? Because it adds value. Sometimes we forget this when we’re building our observability solutions. We get so excited about what we’re tracking that we can lose sight of why we’re tracking it. Technical metrics reveal how systems react to change. What they don’t give is a picture of how change impacts the broader business goals. The importance of qualitative data in business observability is often overlooked.
A selection of live questions and answers from the audience of our recent webinar on how site reliability engineers can best leverage intelligent observability to monitor SLIs and SLOs, prioritize reliability over functionality, and more.
By 2022, Gartner estimates that more than 3 out of 4 global organizations will be running containerized applications in production. With this comes a new set of monitoring challenges — ephemeral, short-lived infrastructure, complex service interdependencies and on-call developers who now need access to data for fast troubleshooting, just to name a few.