Operations | Monitoring | ITSM | DevOps | Cloud

LLM cost optimization: 7 strategies to cut inference spend

LLM cost optimization is the practice of cutting what you spend on large language models, mostly inference, without losing the quality that makes the AI worth running. The biggest levers are routing requests to cheaper models, caching repeated tokens, batching anything that can wait, trimming prompts, right-sizing models, cutting calls you do not need, and putting one gateway and cost view in front of all of it.

Prioritize security findings with the Datadog Runtime Prioritization Engine

If you run a cloud security program, two questions follow almost every security finding: Who owns this? And how important is it? Many security tools answer those questions with static metadata such as owner tags, business criticality labels, and manually maintained inventories of critical assets, known as crown jewels. But cloud environments aren’t static. Teams reorganize, services change hands, and dependencies evolve.

Comprehensive Postgres observability: is your database healthy, and will it stay that way?

A Postgres database is one of the most complex pieces of software you run. It stores your data durably so a power loss doesn't lose a committed transaction. It hands out real transactions while thousands of queries fight over the same rows. It stays available when a node dies, lets you rewind to a point in time after someone drops the wrong table, and constantly tunes itself with background jobs. Two questions matter about all of that machinery: is it healthy right now, and will it stay healthy?

SaaS vs Self-Hosted Observability (Including BYOC): Cost, Latency, Control and Governance

Most teams don't choose an observability deployment model, they inherit one. Someone signed up for a SaaS trial three years ago, telemetry volume grew 40x, and now Finance is asking why the observability line item is the fourth-largest infrastructure cost on the P&L. Or the opposite: a self-hosted Prometheus and Elasticsearch stack was stood up when the company had twelve services, and now it needs a team of two just to keep it upright while everyone else waits on slow dashboards during incidents.

Why the $24 Billion CCaaS Industry Is Rebuilding Itself From the Ground Up

At its annual customer conference in June 2026, the vendor holding the largest revenue share in the global CCaaS market announced a full repositioning of its platform around agentic AI. Its stated reason: “the era of bolted-on AI is over” (CX Today, June 2026).

Cloud Outage Incident Response: Lessons From 2026

Cloud outage incident response stopped being a hypothetical exercise this summer. In a single stretch of July 2026, three of the biggest cloud providers stumbled in quick succession, and the ripple effects reached apps that millions of people use every day. If your team runs anything on a hyperscaler, the events of the last few weeks are a direct message: the question is no longer whether your provider will have a bad day, but whether your on-call rotation is ready when it does.

Kepler Is in Public Preview: One Task, Every Repo, Every Agent

A faster car doesn’t get you home faster if the freeway is still jammed. That is the problem most teams run into once they add a second, third, or fourth AI coding agent to the mix. More agents generate more code. They do not automatically generate more finished work, because someone still has to track which agent is waiting on input, which one just opened a pull request, and which one has been quietly stuck for twenty minutes. Kepler is GitKraken’s answer to that traffic jam.

8 VoIP Quality Metrics: What They Are and How to Measure Them

A dropped call costs more than the interruption itself. It means a missed deal, a frustrated customer, or a support ticket that shouldn't exist. When VoIP quality slips, the usual first sign is vague: calls "sound bad" or "keep cutting out," with no clear starting point for troubleshooting. That vagueness is avoidable. VoIP call quality isn't subjective at the network level.

The best ways to visualize API responses in 2026

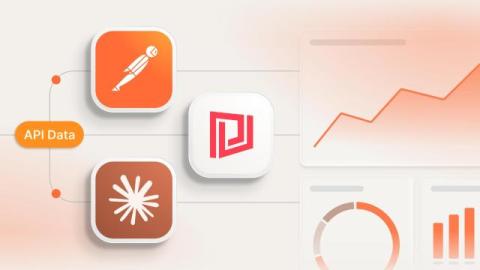
APIs power almost everything we use today, from cloud platforms and monitoring tools to ticketing systems and internal applications. But no matter how useful an API is, the response usually arrives as raw JSON. That's perfectly fine for machines, but much less convenient for people. Whether you're debugging an endpoint, exploring a new service, or building dashboards for your team, you'll probably want a better way to visualize that data. Fortunately, there are several ways to visualize API responses.