Cheap Website Monitoring Pro Plans
Last night we rolled out some new very inexpensive Micro Pro Plans. We've always provided a basic Free Plan alongside Pro Plans which have powerful features and allow monitoring of many websites.


The latest News and Information on Monitoring for Websites, Applications, APIs, Infrastructure, and other technologies.
Last night we rolled out some new very inexpensive Micro Pro Plans. We've always provided a basic Free Plan alongside Pro Plans which have powerful features and allow monitoring of many websites.
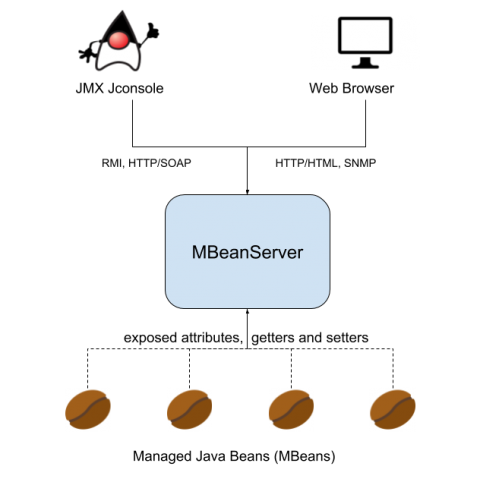
In this tutorial we are going to learn how to instrument Java code to expose application metrics using JMX monitoring. Following the code examples, you can monitor the availability, health and performance of your Java application. Java 1.5 introduced JMX – Java Management eXtensions – which is a standard way to instrument code in the JRE world.
The Trade Desk provides a self-service, cloud-based platform for buyers of online advertising. Since its founding in 2009, TTD has grown into a publicly traded company with more than 900 employees and a market cap of $8.89 billion. The company recently moved from an old monitoring system based on Nagios, Graphite, and a number of homegrown pieces of software, to something more standard, based on Prometheus.
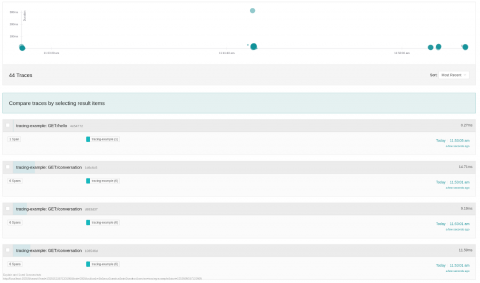
In this article we will demonstrate some of the tracing features of the MicroProfile-OpenTracing project while evaluating performance of new Java runtime Quarkus. You will also learn how a Java application can be compiled to native code for supersonic performance!
The second quarter of 2019 started with a bang for OpsRamp, with recognition from two independent analyst firms, 451 Research and IDC. Three recent analyst reports highlighted OpsRamp’s modern digital and IT operations management platform for dynamic performance insights and maximum visibility.
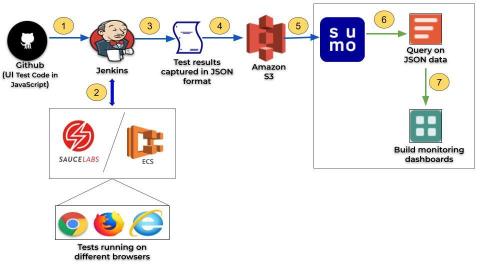
Site reliability engineers (SREs) rely on monitoring and analytics tools like Sumo Logic to guarantee uptime and performance of their applications and various components or services in production. The ability to visually monitor, automatically generate alerts and efficiently troubleshoot an issue in real time has become table stakes for any modern SRE team.
In part 1 of this series, we discuss the rise of Kubernetes and Docker for containerization and container orchestration. I also shared some of the challenges these new technologies present and what sources of data we use to monitor Kubernetes. Part 2 dives into collecting Kubernetes data with Prometheus, plus the pros and cons of that approach. As promised in the conclusion of that post, I’ll address those cons — showing how Sensu and Prometheus form a complementary solution.
How often does your website crash? According to recent research by Hosting Facts, the average website is down three hours per month due to web hosting service issues. But hosting issues aren’t the only reason websites crash.
Since Sentry started, people have been asking us to build integrations for their favorite services. We get it — developer tools are always better when they work together. As Socrates said, teamwork makes the dream work. We like to help out, and that’s why today we’re launching the Sentry Integration Platform. Now you have the power to build the kind of integrations you want to see in Sentry. No need to wait around for us to do it.