Operations | Monitoring | ITSM | DevOps | Cloud

The latest News and Information on Distributed Tracing and related technologies.

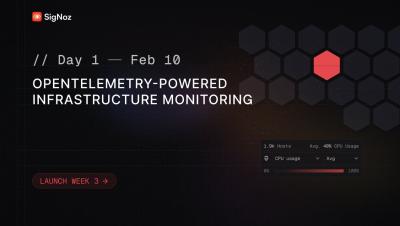
OpenTelemetry-Powered Infrastructure Monitoring - SigNoz Launch Week 3.0 Day 1

Today, we’re excited to announce a much-awaited feature in SigNoz: Infrastructure Monitoring. With our latest OpenTelemetry-powered Infra Monitoring, we bring you a native OpenTelemetry experience that seamlessly integrates infrastructure metrics with application performance data.

Distributed Tracing 101: Definition, Working and Implementation

Modern applications rely on microservices, making it tough to track issues across services. Distributed tracing helps by mapping a request’s journey and pinpointing latency, failures, and dependencies. Unlike traditional monitoring, tracing connects the dots between services, offering deeper visibility. But implementing it isn’t easy—it brings high data volumes, performance overhead, and complexity.

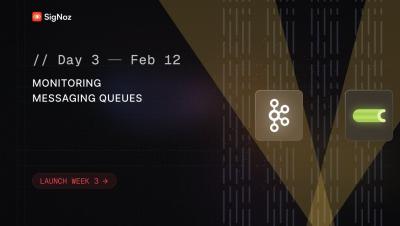
Out-of-the-box OpenTelemetry-powered Kafka & Celery monitoring | SigNoz Launch Week 3.0 Day 3

Today, we are excited to announce OpenTelemetry-powered messaging queue monitoring in SigNoz. Debugging issues in Kafka and Celery queues has traditionally been a black box, with limited correlation between message producers, consumers, and broker metrics. With our messaging queue monitoring, teams can correlate Kafka broker metrics with OpenTelemetry spans, enabling deep insights into consumer lag, throughput, drop rates, and performance bottlenecks.

The Ultimate Guide to OpenTelemetry Visualization

Modern software systems are complex, with multiple services interacting across different environments. Understanding how they behave—tracking performance, identifying bottlenecks, and diagnosing failures—requires more than just collecting data. OpenTelemetry provides a standardized way to gather logs, metrics, and traces, but the real value comes from making that data easy to interpret through visualization.

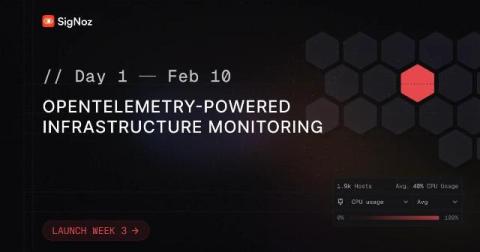
OpenTelemetry-Powered Infrastructure Monitoring

Today, we’re excited to announce a much-awaited feature in SigNoz: Infrastructure Monitoring, built natively on OpenTelemetry. Infrastructure monitoring is a critical aspect of modern observability. Without proper visibility into your infrastructure resources, troubleshooting issues, optimizing costs, and maintaining performance become challenging.

Stop Logging the Request Body!

With more and more people adopting OpenTelemetry and specifically using the tracing signal, I’ve seen an uptick in people wanting to add the entire request and response body as an attribute. This isn’t ideal, as it wasn’t when people were logging the body as text logs. In this blog post, I’ll explain why this is a bad idea, what are the pitfalls, and more importantly, what you should do instead.

Grafana Beyla 2.0: distributed traces, scalable Kubernetes deployments, and more

In November 2023, we released Grafana Beyla 1.0, the first major milestone in our pursuit of zero-code (and zero-effort) eBPF instrumentation. We delivered a way — through a single command-line — to automatically instrument any application supporting HTTP/gRPC protocols, as well as provide basic network packet flow information.