Operations | Monitoring | ITSM | DevOps | Cloud

The latest News and Information on Distributed Tracing and related technologies.

Grafana Loki 101: How to ingest logs with Alloy or the OpenTelemetry Collector

Logs play a critical role in observability, but they do come with their own challenges. Grafana Loki, our horizontally scalable, highly available, multi-tenant log aggregation system, addresses these challenges head on, giving you an open source tool that’s both cost effective and easy to operate.

How to Implement OpenTelemetry in Next.js

OpenTelemetry is an open-source observability framework designed to instrument, generate, collect, and export telemetry data, including traces, metrics, and logs. It is vendor-agnostic, allowing developers to send data to multiple backend services like Last9, Prometheus, Datadog, or Jaeger without vendor lock-in. For Next.js applications, OpenTelemetry is particularly useful due to the framework’s hybrid rendering approach.

OpenTelemetry Is Not "Three Pillars"

OpenTelemetry is a big, big project. It’s so big, in fact, that it can be hard to know what part you’re talking about when you’re talking about it! One particular critique I’ve seen going around recently, though, is about how OpenTelemetry is just ‘three pillars’ all over again. Reader, this could not be further from the truth, and I want to spend some time on why.

How to Monitor Snowflake with OpenTelemetry

Snowflake is a powerful, cloud-based data platform designed for high-performance analytics. Whether you're running massive analytical queries, managing structured and semi-structured data, or optimizing data pipelines, visibility into your Snowflake instance is essential. Performance bottlenecks, query execution delays, and unexpected cost spikes can quickly become issues without proper monitoring.

OpenTelemetry Visualization Setup: A Developer's Guide

If you've ever tried to set up OpenTelemetry visualization, you know it can be a bit overwhelming. But don't worry—in this guide, we'll break it all down step by step. Whether you're just getting started or looking to fine-tune your existing setup, this walkthrough will help you get the most out of your telemetry data.

OpenTelemetry UI: The Ultimate Guide for Developers

If you’ve ever struggled with understanding distributed traces, managing metrics, or debugging complex applications, OpenTelemetry is your best friend. But what about the OpenTelemetry UI? How do you visualize and interact with all that telemetry data? In this guide, we’ll explore the best ways to use OpenTelemetry’s UI options, from setting up a proper observability stack to choosing the right front-end visualization tools.

Integrating OpenTelemetry with Grafana for Better Observability

Modern application observability is essential for ensuring system performance, diagnosing issues, and optimizing user experiences. OpenTelemetry (Otel) and Grafana serve as two key components in achieving end-to-end visibility. While OpenTelemetry focuses on instrumenting applications to collect telemetry data, Grafana specializes in visualizing this data, making it actionable and insightful.

OpenTelemetry: The Future of Observability with Advanced Tracing and Metrics

Hey there! Oscar here. After spending countless hours wrestling with various monitoring tools and proprietary solutions, I wanted to share my thoughts on what I believe is revolutionizing the observability landscape: OpenTelemetry (OTel). OpenTelemetry revolutionizes observability in distributed systems.

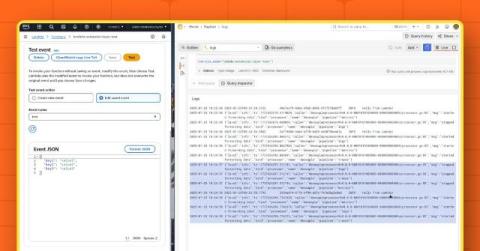
How to observe AWS Lambda functions using the OpenTelemetry Collector and Grafana Cloud

Getting telemetry data out of modern applications is very straightforward—or at least it should be. You set up a collector that either receives data from your application or asks it to provide an up-to-date state of various counters. This happens every minute or so, and if it’s a second late or early, no one really bats an eye. But what if the application isn’t around for long? What if every second waiting for the data to be collected is billed?