Operations | Monitoring | ITSM | DevOps | Cloud

The latest News and Information on Distributed Tracing and related technologies.

A Quick Guide for OpenTelemetry Python Instrumentation

OpenTelemetry is an open-source tool that helps you keep an eye on your application’s performance. Whether you’re building microservices, using serverless setups, or working with a traditional monolithic app, it’s crucial to monitor and trace your app’s behavior for debugging and optimization. OpenTelemetry's Python instrumentation is an excellent way to track traces, metrics, and logs across your entire app.

Easiest Way to Monitor NGINX Performance with OpenTelemetry

If you're looking for a straightforward way to collect NGINX metrics via OpenTelemetry and send them to your Graphite-based monitoring setup, this article is for you! With minimal configuration you’ll be collecting key metrics from your NGINX connections within minutes. In this article, we'll explain how to install the OpenTelemetry Collector, and easily configure it to receive and export NGINX metrics to a Hosted Carbon endpoint.

Discovering the Magic Behind OpenTelemetry Instrumentation - Jose Gomez-Selles | Fosdem 2025

Instrumentation is the secret ingredient that brings observability to life, revealing the intricate workings of applications in ways logs and metrics alone can’t match. In this talk, we’ll dive deep into the magic of OpenTelemetry instrumentation, exploring how to uncover hidden insights within your applications and services.

Scraping NGINX Metrics with OpenTelemetry & Exporting to Carbon

Looking for a straightforward way to collect NGINX metrics with OpenTelemetry and send them to your Graphite-based monitoring setup? Unlike Prometheus, which requires configuring scrape jobs and query language nuances, Carbon/Graphite offers a simpler setup with minimal overhead—just send metrics as plain text and query them easily with familiar tools like Grafana. Whether you're setting up dashboards, alerts, or just keeping an eye on traffic, this guide will get you actionable insights in no time!

Deeper Trace Analytics - Quickly search through all spans, entry spans and root spans

Debugging distributed systems can often feel like searching for a needle in a haystack. When issues arise, devs need faster ways to pinpoint critical spans within their traces. With our latest Deeper Trace Analytics update, we now enable powerful filtering for root and entry spans — making it significantly easier to analyze and debug distributed traces.

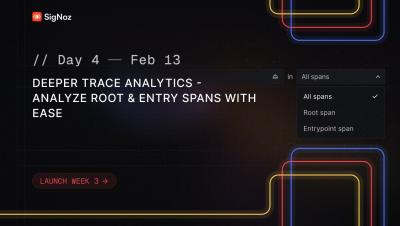
Deeper Trace Analytics - Analyze Root & Entry Spans with Ease | SigNoz Launch Week 3.0 Day 4

Debugging distributed systems can often feel like searching for a needle in a haystack. When issues arise, devs need faster ways to pinpoint critical spans within their traces. With our latest Deeper Trace Analytics update, we now enable powerful filtering for root and entry spans — making it significantly easier to analyze and debug distributed traces.

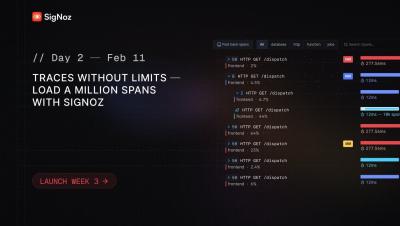
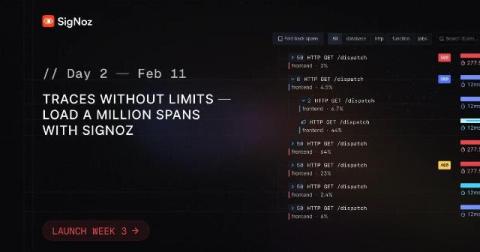
Traces Without Limits - Load a Million Spans with SigNoz

Observability at scale is challenging—especially when dealing with high-volume distributed traces. Traditional tracing tools struggle with large traces containing thousands of spans, often leading to sluggish UIs and an unmanageable debugging experience. Most tracing tools we checked have a limit on the maximum spans they can load for a single trace. But with SigNoz, we’ve redefined what’s possible.