Operations | Monitoring | ITSM | DevOps | Cloud

The latest News and Information on Monitoring for Websites, Applications, APIs, Infrastructure, and other technologies.

OpManager bags gold-listed in Feedspot's top networking blogs and sites to follow in 2019

Great news! The OpManager blog has ranked #15 in Feedspot’s top 100 networking blogs and websites to follow. This is a particularly big deal for ManageEngine as we focus on creating valuable content for IT admins, and to be recognized for that confirms we’re headed in the right direction.

Ask Us Anything: How to Alias Dashboard Variables in Grafana in SQL

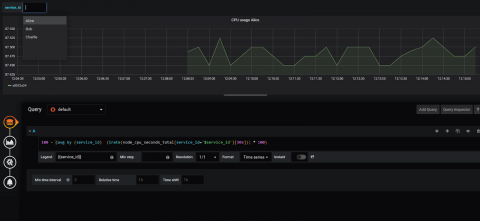
Recently a question came up from a customer, and I was surprised we didn’t have an easy answer for it: How can you translate some esoteric ID or serial number, such as fe03-s3-x883, into a user-friendly name such as “harry” or “alice”? In a regular templating language, it would be easy to do via a map file or similar, but to do this with Grafana is a little more complicated.

Signal Sciences brings real-time web attack visibility to Datadog

Signal Sciences is proud to announce our integration with the Datadog platform. This integration furthers our mission of producing the leading application security offering that empowers operations and development teams to proactively see and respond to web attacks—wherever and however they deploy their apps, APIs, and microservices.

GripMatix releases new Citrix MP

At Squared Up we frequently get asked about Citrix monitoring and dashboards, especially by customers who aren’t paying for the premium ‘Citrix Platinum’ license and so don’t have access to SCOM management pack from Citrix. That’s why we were very excited to hear that there is a new SCOM management pack for monitoring Citrix.

Building Sentry: Source maps and their problems

Welcome to our series of blog posts about all the nitty-gritty details that go into building a great debug experience at scale. Today, we’re looking at the shortcomings of source maps. Other than Python, JavaScript is the oldest platform that Sentry properly supports, which makes sense considering many Python services (including Sentry itself) have a JavaScript front-end. As the popularity of transpiling grew, the need for tools to debug transpiled code in production became obvious.

Coming Soon: Seamless and Cost-Effective Meta Tags for Metrictank

One of the major projects we’re working on for Metrictank – our large scale Graphite solution – is the meta tags feature, which we started last year and are targeting to release in a few months. A lot of people don’t realize this, but Graphite has had tag support for more than a year. Our mission with Metrictank is to provide a more scalable version of Graphite, so introducing meta tags was a logical next step.

Icinga Cube 1.1.0 is out!

As a little introduction for everyone who has not heard about the cube yet: The cube module is there to show statistics grouped by the custom variables that have been set for the hosts and services. They are then displayed in up to three dimensions for a quick overview to show the relations. The most prominent change is the addition of services: While it used to be only possible to have the hosts in a cube, the module has now been extended to provide full functionality with services as well.