Operations | Monitoring | ITSM | DevOps | Cloud

Tracing

The latest News and Information on Distributed Tracing and related technologies.

Performance monitoring with OpenTracing, OpenCensus, and OpenMetrics

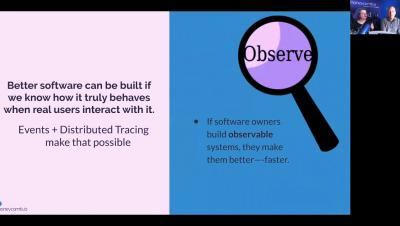
If you are familiar with instrumenting applications, you may have heard of OpenMetrics, OpenTracing, and OpenCensus. These projects aim to create standards for application performance monitoring and collecting metric data. Although the projects do overlap in terms of their goals, they each take a different approach to observability and instrumentation.

Distributed Transaction Tracing: How to Detect Application Performance Issues at The Code Level

Forty-three percent of application performance problems occur because of an issue in the application code, according to a DZone study. Code-level issues include bugs in the code constructs, such as long waits, poor iterations, inefficient code algorithms, unhandled exceptions, bad choice of data structures, etc. Developers and application owners need code-level insight, so they can pinpoint issues in the code and fix them before users notice.

Help! Something is wrong with my Jaeger installation!

Jaeger is composed of different components, each potentially running in its own host. It might be the case that one of these moving parts isn’t working properly, causing spans to not be processed and stored. When something goes wrong, make sure to check the items listed here.

OpenTracing eBook: Distributed Tracing's Emerging Industry Standard

The Cloud Native movement and migration of applications to microservice architectures require general visibility and observability into software behavior. OpenTracing aims to offer a consistent, unified, and tracer-agnostic instrumentation API for a wide range of frameworks, platforms and programming languages.