Operations | Monitoring | ITSM | DevOps | Cloud

March 2023

Implementing OpenTelemetry in React applications

OpenTelemetry can be used to trace React applications for performance issues and bugs. You can trace user requests from your frontend web application to your downstream services. OpenTelemetry is an open-source project under the Cloud Native Computing Foundation (CNCF) that aims to standardize the generation and collection of telemetry data. React (also known as React.js or ReactJS) is a free and open-source frontend JavaScript library for building user interfaces based on UI components.

Integrating OpenTelemetry into a Fluentbit environment using BindPlane OP

Fluentbit is a popular logs and metrics collector used for monitoring anything from virtual machines to containerized applications. With the rise of BindPlane OP and OpenTelemetry, it is not uncommon for organizations to begin replacing Fluentbit, or integrating OpenTelemetry with Fluentbit. An organization may have hundreds or thousands of Fluentbit agents deployed to their endpoints but they want to manage the pipeline using BindPlane OP.

Elastic Observability: Built for open technologies like Kubernetes, OpenTelemetry, Prometheus, Istio, and more

As an operations engineer (SRE, IT Operations, DevOps), managing technology and data sprawl is an ongoing challenge. Cloud Native Computing Foundation (CNCF) projects are helping minimize sprawl and standardize technology and data, from Kubernetes, OpenTelemetry, Prometheus, Istio, and more. Kubernetes and OpenTelemetry are becoming the de facto standard for deploying and monitoring a cloud native application.

Trace at Your Own Pace: Three Easy Ways to Get Started with Distributed Tracing

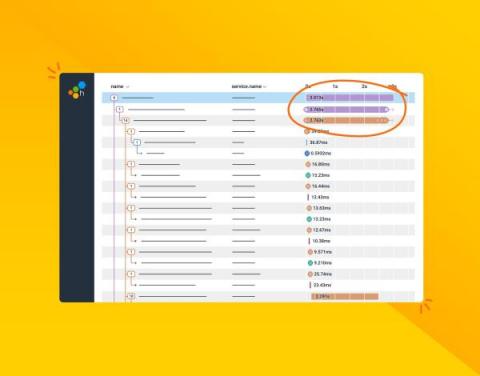
Stepping through a trace is an invaluable debugging workflow, providing a way to follow requests from service to service even as the applications we manage become more complex and distributed. That same complexity can make getting started with distributed tracing feel overwhelming, but it’s important to remember that instrumenting your code is an additive process—you don’t need to boil the ocean. A trace through a thousand services starts with a single ID.

Learn How NS1 Uses Distributed Tracing to Release Code More Quickly and Reliably

Chris Bertinato, Software Architect at NS1, and Nate Daly, Head of Architecture at NS1 along with Jessica Kerr, Honeycomb Developer Advocate, and Account Executive Scott Phillips discuss how NS1 used distributed tracing to scale their organization and accelerate their migration from a monolith to microservices.

Redis Monitoring with OpenTelemetry and SigNoz

In this post, we will show you how to set up Redis monitoring with SigNoz - an open-source full-stack APM. SigNoz captures data using OpenTelemetry, which is becoming the world standard for instrumenting cloud-native applications. Apart from capturing metrics from your Redis server, you can also capture logs and traces with OpenTelemetry.

AMA: Getting Started with OpenTelemetry and Sentry

Join the Sentry developers who built Sentry’s OpenTelemetry support and learn how to understand the performance of your OTel instrumented applications. As the leading open standard for observability, thousands of companies use OpenTelemetry to capture data across their services - but capturing raw logs, traces, and metrics is only the first step in improving software performance.

API observability: Leveraging OTel to improve developer experience

APIs provide a way to simplify development, reduce costs, and create more flexible and scalable applications. Much of today’s development relies on APIs – in the integration of third-party services, in the communication between microservices, in mobile app development, and in other use cases. Some APIs even exist as products themselves for customers to use.

Easily configure Elastic to ingest OpenTelemetry data

Watch how to easily configure your application to ingest Elastic OpenTelemetry data. About Elastic Elastic is the leading platform for search-powered solutions, and we help everyone — organizations, their employees, and their customers — find what they need faster, while keeping applications running smoothly, and protecting against cyber threats. When you tap into the power of Elastic Enterprise Search, Observability, and Security solutions, you’re in good company with brands like Netflix, Uber, Slack, Microsoft, and thousands of others who rely on us to accelerate results that matter.

OpenTelemetry Browser Instrumentation Complete Tutorial

Browser instrumentation refers to collecting and analyzing data about a user's interactions with a web browser. This type of instrumentation involves using specialized tools and techniques to gather information about how a website is being used, such as page load times, network requests, and user interactions. The data collected through browser instrumentation can be used to improve website performance, identify and troubleshoot errors, and gain insights into user behavior.

Deploy Open Telemetry to Kubernetes in 5 minutes

OpenTelemetry is an open-source observability framework that provides a vendor-neutral and language-agnostic way to collect and analyze telemetry data. This tutorial will show you how to integrate OpenTelemetry on Kubernetes, a popular container orchestration platform. Prerequisites.

A Beginner's Guide to OpenTelemetry

OpenTelemetry (OTel) is an open-source observability framework that provides a standardized way of collecting, processing, and exporting telemetry data (metrics, traces, and logs) from distributed systems. It was born by a merger between two previously separate observability projects, OpenCensus and OpenTracing, and it is currently maintained by the Cloud Native Computing Foundation (CNCF).

Evaluating distributed tracing tools: A guide

Adopting a distributed tracing solution to make an application more observable and maintainable is one of the most common key initiatives modern R&D teams have on their plates currently. With the move to microservices architectures, development teams are finding that it’s taking them longer to build applications due to tasks that are growing in complexity.

OpenTelemetry vs Datadog - Choosing between OpenTelemetry and Datadog

OpenTelemetry and DataDog are both used for monitoring applications. While OpenTelemetry is an open source observability framework, DataDog is a cloud-monitoring SaaS service. OpenTelemetry is a collection of tools, APIs, and SDKs that help generate and collect telemetry data (logs, metrics, and traces). OpenTelemetry does not provide a storage and visualization layer, while DataDog does.

The Importance of Azure Distributed Tracing in Integration Services

Distributed Tracing, combined with end-to-end monitoring, lets organizations keep track of their business transactions and receive alerts when anomalies happen. End-to-end monitoring benefits business users and functional administrators more than developers and technical administrators. Nowadays, for developing integration solutions, microservice architectures are becoming the norm. A solution based on such an architecture relies on different services that shape a specific solution together.

Golang Distributed Tracing - OpenTelemetry Based Observability

OpenTelemetry (OTel in short) is an open-source observability framework that provides a standard set of vendor-agonistic SDKs, APIs, and tools to connect with observability backends. It supports all major programming languages, including Java, Python, Node.js, and Go. However, Golang tracing by integrating OTel with Golang is particularly challenging due to several reasons.

Understanding Distributed Tracing with a Message Bus

So you're used to debugging systems using a distributed trace, but your system is about to introduce a message queue—and that will work the same… right? Unfortunately, in a lot of implementations, this isn't the case. In this post, we'll talk about trace propagation (manual and OpenTelemetry), W3C tracing, and also where a trace might start and finish.

How 3 Companies Implemented Distributed Tracing for Better Insight into Their Systems

Distributed tracing enables you to monitor and observe requests as they flow through your distributed systems to understand whether these requests are behaving properly. You can compare tiny differences between multiple traces coming through your microservices-based applications every day to pinpoint areas that are affecting performance. As a result, debugging and troubleshooting are simpler and faster.