Operations | Monitoring | ITSM | DevOps | Cloud

November 2021

OpenTelemetry Browser Instrumentation

One of the most common questions we get at Honeycomb is “What insights can you get in the browser?” Browser-based code has become orders of magnitude more complex than it used to be. There are many different patterns, and, with the rise of Single Page App frameworks, a lot of the code that is traditionally done in a backend or middle layer is now being pushed up to the browser. Instead, the questions should be: What insights do frontend engineers want?

How to Keep Traces for Slow and Failed Requests

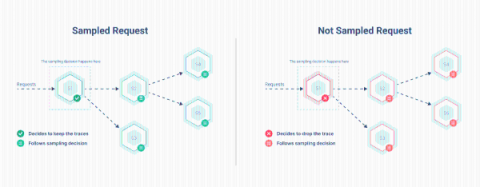
Today we are introducing Local Tail-Based sampling in Kamon Telemetry! We are going to tell you all about it in a little bit but before that, let’s take a couple minutes to explore what is sampling, how it is used nowadays, and what motivated us to including local tail sampling in Kamon Telemetry.

Announcing Service Performance Monitoring in Early Access

Today, we’re thrilled to announce the early access of our Service Performance Monitoring capability. As today’s DevOps teams know all too well, monitoring application requests in modern microservices architectures is extremely difficult. Requests typically travel across a vast ecosystem of microservices and, as a result, it is often a significant challenge to pinpoint a specific failure in one of these underlying services.

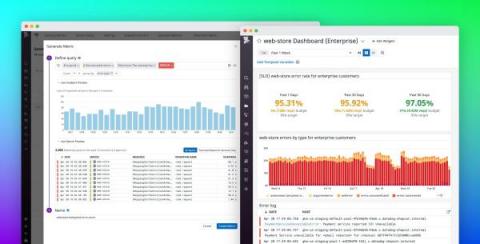
Generate span-based metrics to track historical trends in application performance

Tracing has become essential for monitoring today’s increasingly distributed architectures. But complex production applications produce an extremely high volume of traces, which are prohibitively expensive to store and nearly impossible to sift through in time-sensitive situations. Most traditional tracing solutions address these operational challenges by making sampling decisions before a request even begins its path through your system (i.e., head-based sampling).

How Using Annotations with OpenTelemetry Can Lower Your MTTR

When it comes to gaining control over complex distributed systems, there are many indicators of performance that we must understand. One of the secrets to understanding complicated systems is the use of additional cardinality within our metrics, which provides further information about our distributed systems’ overall health and performance. Developers rely on the telemetry captured from these distributed workloads to determine what really went wrong and place it in context.

Observability into Your FinOps: Taking Distributed Tracing Beyond Monitoring

Distributed tracing has been growing in popularity as a primary tool for investigating performance issues in microservices systems. Our recent DevOps Pulse survey shows a 38% increase year-over-year in organizations’ tracing use. Furthermore, 64% of those respondents who are not yet using tracing indicated plans to adopt it in the next two years. However, many organizations have yet to realize just how much potential distributed tracing holds.

Logs and tracing: not just for production, local development too

We're a small team of engineers right now, but each engineer has experience working at companies who invested heavily in observability. While we can't afford months of time dedicated to our tooling, we want to come as close as possible to what we know is good, while running as little as we can- ideally buying, not building. Even with these constraints, we've been surprised at just how good we've managed to get our setup.

Grafana Tempo 1.2 released: New features make monitoring traces 2x more efficient

Grafana Tempo 1.2 has been released! Among other things, we are proud to present both our first version to support search and the most performant version of Tempo ever released. There are also some minor breaking changes so make sure to check those out below. If you want ALL the details you can always check out the v1.2 changelog, but if that’s too much, this post will cover all the big ticket items.

Introducing Grafana Enterprise Traces, joining metrics and logs in the Grafana Enterprise Stack observability solution

Today, we are launching a new Grafana Labs product, Grafana Enterprise Traces. Powered by Grafana Tempo, our open source distributed tracing backend,.and built by the maintainers of the project, this offering is an exciting addition to our growing self-managed observability stack tailored for enterprises.

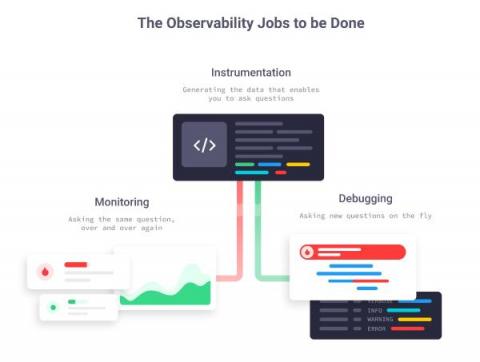
Observability in Practice

After years of helping developers monitor and debug their production systems, we couldn’t help but notice a pattern across many of them: they roughly know that metrics and traces should help them get the answers they need, but they are unfamiliar with how metrics and traces work, and how they fit into the bigger observability world. This post is an introduction to how we see observability in practice, and a loose roadmap for exploring observability concepts in the posts to come.

What's New in OpenTelemetry: Community, Distributions, and Roadmap

I am honored to be able to talk about Splunk’s investment and commitment to the OpenTelemetry project. I would like to take this opportunity to talk about the latest in the OpenTelemetry community, as well as the instrumentation and data collection distributions available from Splunk. Be sure to read through the whole post, as you will find some roadmap information too!

My goals as a newly elected OpenTelemetry Governance Committee member

I joined Grafana Labs as a software engineer in October to help build out a team focused on OpenTelemetry, and within a few weeks, I was promptly encouraged to run for a seat on the OpenTelemetry board. Every year, the OpenTelemetry community holds elections for a few seats on the Governance Committee board, which oversees the project at large. The results of this year’s elections are now available, and I am glad to share that I have been elected to serve on the board!

Why Use OpenTelemetry Processors to Change Collected Backend Data

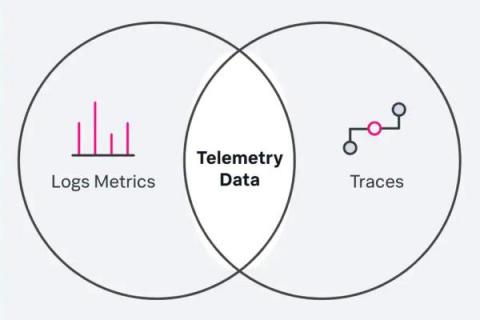
When managing distributed environments, we find ourselves challenged with looking for different ways to understand performance better. Telemetry data is critical for solving such a challenge and helping DevOps and IT groups understand these systems’ behavior and performance. To get the most from telemetry data, it has to be captured and analyzed, then tagged to add relevant context, all while being sure to maintain the security and efficiency of user and business data.