Operations | Monitoring | ITSM | DevOps | Cloud

June 2021

Tracing the Path to Clear Visibility in DevOps

Today, we’re excited to announce enhancements to the VMware Tanzu Observability by Wavefront platform, which helps teams scale their observability practices and shorten the feedback loops between development and operations. The new features give more flexibility and functionality to any open source investments; help operations, development, and SRE teams resolve problems faster; and extend observability more efficiently into DevOps workflows. Here’s a quick rundown of what’s new.

Conditional Distributed Tracing

Distributed tracing is generally a binary affair—it's off or on. Either a trace is sampled or, according to a flag, it's not. Span placement is also assumed to be an "always-on" system where spans are always added if the trace is active. For general availability and service-level objectives, this is usually good enough. But when we encounter problems, we need more. In this talk, I'll show you how to "turn up the dial" with detailed diagnostic spans and span events that are inserted using dynamic conditions.

OpenTelemetry, Not Just for Production Troubleshooting

OpenTelemetry, Not Just for Production Troubleshooting: How to Prevent Downtime as Early as Local Dev OpenTelemetry is a great tool for observability and debugging in production. It provides you with data that empowers understanding of what is slow or broken, as well as what you can do to fix problems that occur in production. But what if you could leverage those same OpenTelemetry capabilities in pre-production? What if you could use those capabilities during development and testing phases to proactively prevent downtime in production?

Instrumenting Java Applications for Tracing with OpenTelemetry and Jaeger

The aim of this article is to demonstrate how you can instrument a Java application using Opentelementry and Jaeger. In this example, we will be instrumenting our Java application using OpenTelemetry and the OpenTelemetry Java client, and the tracing data will be exported and visualized using Jaeger. We will use the Logz.io Jaeger backend as it is compatible with common tracing standards like Zipkin, OpenTelemetry, and OpenTracing.

Real-time distributed tracing for Go and Java Lambda Functions

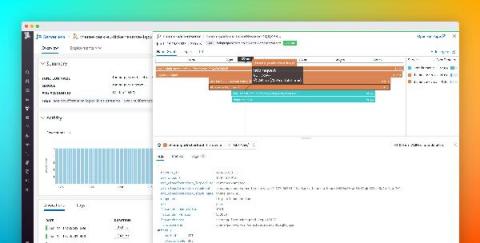
Serverless applications streamline development by allowing you to focus on writing and deploying code rather than managing and provisioning infrastructure. To help you monitor the performance of your serverless applications, last year we released distributed tracing for AWS Lambda to provide comprehensive visibility across your serverless applications.

Instrumenting Microservices with Istio for Distributed Tracing

Previously, I wrote a Beginner’s Guide to Jaeger + OpenTracing Instrumentation for Go providing guidance on manually instrumenting Go services. This is useful for cases where we want fine-grained tracing of specific functions. However, what if all we want is to trace a service’s inbound and outbound calls with little to no additional code?

Find the Root Cause Faster with Trace View and Trace Navigator

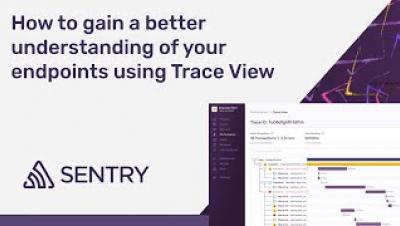
Like a bratty teenager, traditional monitoring answers your questions, but does so in a terse, unhelpful manner: Why is my page slow? Guess it’s the API call. It’s a 504 thing — you wouldn’t understand. Ok, so why is the API call slow? Ask your DB query. Gosh! You need a better conversation with your code — one which gives you contextual clues about your application’s performance.

How to Monitor Application Logs

In the beginning, there was the Log – or to be a bit more precise, there were application logs. At least that's how it was in the early days of application development, when raw log data itself was more often than not the point where troubleshooting began. Now, of course, the starting point for troubleshooting with cloud-based applications is much more likely to be an automatically-generated alert, or an indication on a monitoring dashboard that something isn't quite right.

Collecting Kafka Performance Metrics with OpenTelemetry

In a previous blog post, "Monitoring Kafka Performance with Splunk," we discussed key performance metrics to monitor different components in Kafka. This blog is focused on how to collect and monitor Kafka performance metrics with Splunk Infrastructure Monitoring using OpenTelemetry, a vendor-neutral and open framework to export telemetry data. In this step-by-step getting-started blog, we will.

Two Quick Ways to Create Spans with Kamon Telemetry

If you already had some experience with Kamon, you probably saw Kamon create Spans automatically for a lot of stuff, including HTTP server requests, database calls, actor messages, and more. But what happens when you want to create Spans for methods or code blocks that Kamon doesn’t instrument automatically? Let’s look at the two simplest ways to create Spans programmatically with Kamon.

Error logging, tracing, and improving developer workflow with Jeffrey T. Fritz

Today Nico joined Jeffrey T. Fritz on the Fritz and Friends live coding stream and we talked about how Rollbar can be added to your applications to provide better logging, error tracking, and reporting. We walked through the story of Rollbar and added the logging solution to the KlipTok service that manages interactions with internet bots for the various social networks and search engines. See why 100,000+ developers trust Rollbar to analyze, diagnose & fix errors in record time.