Operations | Monitoring | ITSM | DevOps | Cloud
September 2023
What's New in OpenTelemetry?
OpenTelemetry (OTEL) is an observability platform designed to generate and collect telemetry data across various observability pillars, and its popularity has grown as organizations look to take advantage of it. It’s the most active Cloud Native Computing Foundation project after Kubernetes, and it’s progressing at an immense pace on many fronts. The core project is expanding beyond the “three pillars” into new signals, such as continuous profiling.
Introducing the Prometheus Java client 1.0.0
PromCon, the annual Prometheus community conference, is around the corner, and this year I’ll have exciting news to share from the Prometheus Java community: The highly anticipated 1.0.0 version of the Prometheus Java client library is here! At Grafana Labs, we’re big proponents of Prometheus. And as a maintainer of the Prometheus Java client library, I highly appreciate the support, as it helps us to drive innovation in the Prometheus community.
Convergence of Observability and Security: A New Era
Observability and security are converging, benefiting dev and security teams. Runtime observability is the missing component to this important endeavor, providing much-needed data and insights to DevSecOps and AppSec teams.
OpenTelemetry Webinars: Logging in OpenTelemetry
OpenTelemetry metrics: A guide to Delta vs. Cumulative temporality trade-offs
In OpenTelemetry metrics, there are two temporalities, Delta and Cumulative and the OpenTelemetry community has a good guide on the different trade-offs of each. However, the guide tackles the problem from the SDK end. It does not cover the complexity that arises from the collection pipeline. This post takes that into account and covers the architecture and considerations that are involved end-to-end for picking the temporality.
Auto-Instrumenting OpenTelemetry for Kafka
Apache Kafka, born at LinkedIn in 2010, has revolutionized real-time data streaming and has become a staple in many enterprise architectures. As it facilitates seamless processing of vast data volumes in distributed ecosystems, the importance of visibility into its operations has risen substantially. In this blog, we’re setting our sights on the step-by-step deployment of a containerized Kafka cluster, accompanied by a Python application to validate its functionality. The cherry on top?
OpenTelemetry vs. OpenTracing
OpenTelemetry vs. OpenTracing - differences, evolution, and ways to migrate to OpenTelemetry.
OpenTelemetry Webinar: What is the OpenTelemetry API
Making design decisions for ClickHouse as a core storage backend in Jaeger
ClickHouse database has been used as a remote storage server for Jaeger traces for quite some time, thanks to a gRPC storage plugin built by the community. Lately, we have decided to make ClickHouse one of the core storage backends for Jaeger, besides Cassandra and Elasticsearch. The first step for this integration was figuring out an optimal schema design. Also, since ClickHouse is designed for batch inserts, we also needed to consider how to support that in Jaeger.
Auto-Instrumenting Node.js with OpenTelemetry & Jaeger
Six months ago I attempted to get OpenTelemetry (OTEL) metrics working in JavaScript, and after a couple of days of getting absolutely no-where, I gave up. But here I am, back for more punishment... but this time I found success! In this article I demonstrate how to instrument a Node.js application for traces using OpenTelemetry and to export the resulting spans to Jaeger. For simplicity, I'm going to export directly to Jaeger (not via the OpenTelemetry Collector).
Understanding OpenTelemetry Spans in Detail
How to to filter trace spans in Grafana 10.1
Grafana 10.1: TraceQL query results streaming
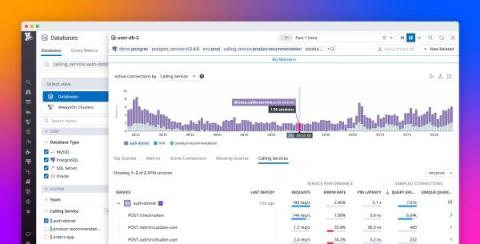
Seamlessly correlate DBM and APM telemetry to understand end-to-end query performance
When the services in your distributed application interact with a database, you need telemetry that gives you end-to-end visibility into query performance to troubleshoot application issues. But often there are obstacles: application developers don’t have visibility into the database or its infrastructure, and database administrators (DBAs) can’t attribute the database load to specific services.
Troubleshoot failed performance tests faster with Distributed Tracing in Grafana Cloud k6
Performance testing plays a critical role in application reliability. It enables developers and engineering teams to catch issues before they reach production or impact the end-user experience. Understanding performance test results and acting on them, however, has always been a challenge. This is due to the visibility gap between the black-box data from performance testing and the internal white-box data of the system being tested.
How to correlate performance testing and distributed tracing in Grafana Cloud k6
Native OpenTelemetry support in Elastic Observability
OpenTelemetry is more than just becoming the open ingestion standard for observability. As one of the major Cloud Native Computing Foundation (CNCF) projects, with as many commits as Kubernetes, it is gaining support from major ISVs and cloud providers delivering support for the framework. Many global companies from finance, insurance, tech, and other industries are starting to standardize on OpenTelemetry.
Best practices for instrumenting OpenTelemetry
OpenTelemetry (OTel) is steadily gaining broad industry adoption. As one of the major Cloud Native Computing Foundation (CNCF) projects, with as many commits as Kubernetes, it is gaining support from major ISVs and cloud providers delivering support for the framework. Many global companies from finance, insurance, tech, and other industries are starting to standardize on OpenTelemetry.
Comparing Datadog and New Relic's support for OpenTelemetry data
OpenTelemetry Webinar: What *is* the OpenTelemetry API?
Getting started with OpenTelemetry instrumentation with a sample application
Application performance management (APM) has moved beyond traditional monitoring to become an essential tool for developers, offering deep insights into applications at the code level. With APM, teams can not only detect issues but also understand their root causes, optimizing software performance and end-user experiences. The modern landscape presents a wide range of APM tools and companies offering different solutions. Additionally, OpenTelemetry is becoming the open ingestion standard for APM.
Cloud data control: Introducing the OpenTelemetry Arrow Project
In collaboration with F5, ServiceNow® Cloud Observability is pleased to announce the availability of the OpenTelemetry Arrow Project. This co-donated and co-developed project gives organizations greater control over the data extracted from their cloud applications—as well as a path forward to improve the return on investment (ROI) of that data.
OpenTelemetry Gotchas: Phantom Spans
This guest post is written by Ian Duncan, Staff Engineer - Stability Team at Mercury. To view the original post, go to Ian's website. At work, we use OpenTelemetry extensively to trace execution of our Haskell codebase. We struggled for several months with a mysterious tracing issue in our production environment wherein unrelated web requests were being linked together in the same trace, but we could never see the root trace span.
Helios Joins the AWS Marketplace!
We are thrilled to announce that Helios, the applied observability platform for developers, is now available on the AWS Marketplace! This marks a significant milestone in providing visibility and runtime insights for easy troubleshooting and reduced MTTR. This further cements our commitment to providing top-tier services to our customers and to AWS users. By bringing Helios directly to the AWS Marketplace, it is easier than ever to access and onboard our platform.
Sending and Filtering Python Logs with OpenTelemetry
How to Manually Instrument Java with OpenTelemetry (Part 1)
How to Manually Instrument Java with OpenTelemetry (Part 2)
Manual instrumentation of Java applications with OpenTelemetry
In the fast-paced universe of software development, especially in the cloud-native realm, DevOps and SRE teams are increasingly emerging as essential partners in application stability and growth. DevOps engineers continuously optimize software delivery, while SRE teams act as the stewards of application reliability, scalability, and top-tier performance. The challenge?
Deploying the OpenTelemetry Collector to Kubernetes with Helm
The OpenTelemetry Collector is a useful application to have in your stack. However, deploying it has always felt a little time consuming: working out how to host the config, building the deployments, etc. The good news is the OpenTelemetry team also produces Helm charts for the Collector, and I’ve started leveraging them. There are a few things to think about when using them though, so I thought I’d go through them here.
The Best and Worst Reasons to Adopt OpenTelemetry
It was a rainy day in Seattle at KubeCon + CloudNativeCon North America in December 2018 when I first encountered the term ‘OpenTelemetry.’ At that time, I was an active member of a working group focused on developing W3C Trace Context, a standard now extensively employed for context propagation in distributed systems.
Auto-instrumentation of .NET applications with OpenTelemetry
In the fast-paced universe of software development, especially in the cloud-native realm, DevOps and SRE teams are increasingly emerging as essential partners in application stability and growth. DevOps engineers continuously optimize software delivery, while SRE teams act as the stewards of application reliability, scalability, and top-tier performance. The challenge?


