Operations | Monitoring | ITSM | DevOps | Cloud
February 2022
Jaeger Tracing: A Friendly Guide for Beginners
Written by @thetomzach @ Aspecto. In this guide, you’ll learn what Jaeger tracing is, what distributed tracing is, and how to set it up in your system. We’ll go over Jaeger’s UI and touch on advanced concepts such as sampling and deploying in production. You’ll leave this guide knowing how to create spans with OpenTelemetry and send them to Jaeger tracing for visualization. All that, from scratch.
OpenTelemetry (OTel) is opening new possibilities for developers
OpenTelemetry (OTel) is emerging as the industry standard for system observability and distributed tracing across cloud-native and distributed architectures. But where do developers fit in? With OTel’s main use case focusing on production monitoring and observability, I find that many developers are still not fully familiar with OTel. Others believe it is more of a tool for DevOps/SRE.
Ask Miss O11y: OpenTelemetry in the Front End: Tracing Across Page Load
Ah, good question! TL;DR: store the start time of the span, and then create the span on the new page. Usually, you want to start a span, do some work, and then end the span. The whole span gets sent to your OpenTelemetry collector (and thence to Honeycomb) when you end it. But when a page load happens, that span object is lost. Honeycomb never hears about it becausespan.end()wasn’t called. How can we deal with this? Create the span only on the new page, where you can end it. But!
Why OpenTelemetry (OTel) is a game changer for troubleshooting your applications
Microservices are powerful architectures. Yet, they are complicated ones as well. Microservices enable engineering departments to scale faster than ever, but this speed comes at the price of developer confidence. When developing microservices, it is hard for developers to understand how different services interact with each other and why a certain event occurred when and where it did.
Introducing exemplar support in Grafana Cloud, tightly coupling traces to your metrics
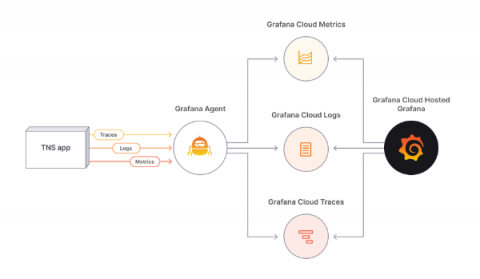
We’ve talked in previous posts about why we think the concept of exemplars are so valuable: They make it easy to jump from metrics into exactly the right traces, eliminating the needle in the haystack problem. We were enthusiastic enough about the idea that we helped contribute the necessary code changes to bring this functionality to the Prometheus ecosystem.
Implementing distributed tracing in a nodejs application
Ask Miss O11y: Making Sense of OpenTelemetry-Context
“What is up with the Context in OpenTelemetry? Why do I need to mess with it at all? Why, when I set a span as active, don’t subsequent spans just use it as a parent?” Oh, yikes, yeah. The Context abstraction in OpenTelemetry is hard to understand. Here are several ways it’s tricky.
How Distributed Tracing Saves Time and Money
In this modern era, most companies want to make customers happy using emerging technologies. This is why they utilize multiple types of tools and new technologies to attract customers in their funnel and finally convert them into leads. However, it has some demerits too.
Ask Miss O11y: Making Sense of OpenTelemetry-Tracer and TracerProvider
OpenTelemetry is a strong standard for instrumentation because it is built of careful, well-thought-out abstractions created by experts in the space. OpenTelemetry feels painful to start using because it’s full of abstractions that make sense to experts in the space. For a developer who wants to think about their own software and not spend a month becoming an expert in telemetry, this is hard. For high-level conceptual description, there’s the OpenTelemetry specification.
Usual Performance Suspects: Introducing Suspect Spans
A trace is the end-to-end journey of one or more connected spans and a span is an operation or “work” taking place on a service. So when it comes to debugging a performance issue, being able to pick out slow spans out of a line up is the fastest way to seeing the root cause and knowing how to solve it. Suspect Spans surfaces a list of spans that correspond to where the most time in a transaction is spent.
How to Configure the Opentelemetry Collector to Begin Collecting Metrics
OpenTelemetry enables Observability, and building observable systems requires you to understand the various ways in which they can fail. Jumping from one possible fix to another and one change to another without fully recognizing the impact on the system can be a significant hindrance to a successful customer experience. In this post, I’ll explain how to get started with OpenTelemetry to help you make your systems more observable.
Code coverage for eBPF programs
I bet we all have heard so much about eBPF in recent years. Data shows that eBPF is quickly becoming the first choice for implementing tracing and security applications, and Elastic is also working relentlessly on supercharging our security solutions (and more) with eBPF. However, one major challenge is that the eBPF ecosystem lacks tooling to make developers' lives easier. eBPF programs are written in C but compiled for a specific ISA later executed by the eBPF Virtual Machine.
What is OpenTelemetry and Why is Scout All In?
Before we talk about OpenTelemetry, we should talk about telemetry. Telemetry is: And an instrument is: For the purpose of measuring running computer software and systems, our instruments are virtual instruments. That is to say, code that measures other code. It sounds simple: read a measurement and send it to a remote location. In practice, to make that telemetry data useful in today’s cloud-native and ever more complex environments, there are huge logistical and technical hurdles to overcome.
Configuring OpenTelemetry in Ruby
OpenTelemetry is enabling a revolution in how Observability data is collected and transmitted. See our What Is OpenTelemetry post on why this is an important inflection point in the Observability space. In this post, we’ll walk through how to configure the OpenTelemetry Gems within a Rails app.


