Operations | Monitoring | ITSM | DevOps | Cloud
October 2021
Instrumentation for C# .NET Apps with OpenTelemetry
OpenTelemetry is the recommended path today for instrumenting applications with tracing in a standard, vendor-agnostic and future-proof way. In fact, OpenTelemetry (nicknamed OTEL) encompasses all three pillars of observability: tracing, metrics, and logs. The tracing element of the specification is now stable with the rest following. This is innovative stuff! You can read more on OpenTelemetry and the current release state on this guide.
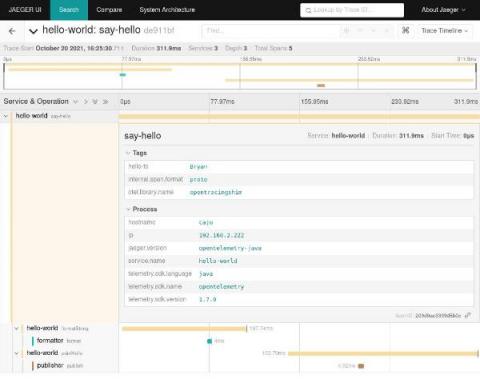
Migrating from Jaeger client to OpenTelemetry SDK
A couple of years ago, the OpenTelemetry project was founded by the merger of two similarly aimed projects: OpenTracing and OpenCensus. One of the goals of this new project was to create an initial version that would “just work” with existing applications instrumented using OpenTracing and OpenCensus.
Auto-Instrumenting Python Apps with OpenTelemetry
In this tutorial, we will go through a working example of a Python application auto-instrumented with OpenTelemetry. To keep things simple, we will create a basic “Hello World” application using Flask, instrument it with OpenTelemetry’s Python client library to generate trace data and send it to an OpenTelemetry Collector. The Collector will then export the trace data to an external distributed tracing analytics tool of our choice.
Vendor Switching With OpenTelemetry (OTel)
You might already know that OpenTelemetry is the future of instrumentation. It’s an open-source and vendor-neutral instrumentation framework that frees you from the trap of using proprietary libraries simply to understand how your code is behaving. Best of all, you can instrument your applications just once and then take that instrumentation to any other backend system of your choice. This blog shows you exactly how to use OpenTelemetry to ✨break the vendor lock-in cycle.✨


