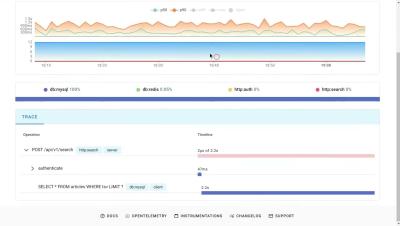
Operations | Monitoring | ITSM | DevOps | Cloud

April 2022

Ask Miss O11y: When should you delete instrumentation?

When do you delete instrumentation? You delete instrumentation when you delete code. Other than that, if you’re doing things right: almost never. One of the best things about honeycomb is that it completely transforms the incentives around preserving instrumentation. With metrics-based tools, the most valuable metrics are always custom metrics. You need to define a custom metric for literally any question you might ever want to ask about the app and its utilization or performance.

How to Monitor Redis with OpenTelemetry

We’re excited to announce that we’ve recently contributed Redis monitoring support to the OpenTelemetry collector. You can check it out here! You can utilize this receiver in conjunction with any OTel collector: including the contrib collector, the observIQ’s distribution of the collector, as well as Google’s Ops Agent, as a few examples.

Set up and observe a Spring Boot application with Grafana Cloud, Prometheus, and OpenTelemetry

Spring Boot is a very popular microservice framework that significantly simplifies web application development by providing Java developers with a platform to get started with an auto-configurable, production-grade Spring application. In this blog, we will walk through detailed steps on how you can observe a Spring Boot application, by instrumenting it with Prometheus and OpenTelementry and by collecting and correlating logs, metrics, and traces from the application in Grafana Cloud.

Distributed Tracing Best Practices for Microservices

The management of modern software environments hinges on the three so-called “pillars of observability”: logs, metrics and traces. Each of these data sources provides crucial visibility into applications and the infrastructure hosting them. For many IT operations and site reliability engineering (SRE) teams, two of these pillars — logs and metrics — are familiar enough.

Ask Miss O11y: Baggage in OTel

Miss O11y is delighted to welcome our newest band member: Martin Thwaites! Martin has been a member of the Honeycomb user community practically since its inception. He is a UK-based consultant who specializes in helping teams scale up and tackle challenging business problems, and a long-time contributor to the Azure and.NET communities. We think he looks ✨amazing✨ in a tiara.

New StackPod Episode: OpenTelemetry - the Future of Observability?

OpenTelemetry has been getting a lot of attention in the observability field. Moreover, in StackState’s latest release, we added support for OpenTelemetry traces. Melcom van Eeden, software developer at StackState, was one of our developer champions who made this possible. In addition to joining us on this episode of StackPod, he wrote a blog post on how to leverage OpenTelemetry with StackState and he recorded a tutorial video about the topic.

Ask Miss O11y: Logs vs. Traces

Ah, good question! TL;DR: Trace instead of log. Traces show connection, performance, concurrency, and causality. Logs are the original observability, right? Back in the day, I did all my debugging with `printf.` Sometimes I still write `console.log(“JESS WAS HERE”)` to see that my code ran. That’s instrumentation, technically. What if I emitted a “JESS WAS HERE” span instead? What’s so great about a span in a trace? Yeah, and so do logs in any decent framework.

Implementing OpenTelemetry in Angular application

OpenTelemetry can be used to trace Angular applications for performance issues and bugs. OpenTelemetry is an open-source project under the Cloud Native Computing Foundation (CNCF) that aims to standardize the generation and collection of telemetry data. Telemetry data includes logs, metrics, and traces. Angular is a frontend Javascript framework that uses HTML and Typescript. It’s a popular framework used by many organizations for their frontend applications.

When code fails in production - and how to fix it in minutes

All developers know that moment when, after we’ve reviewed everything and completed our sanity tests, our code somehow doesn’t work in production. The question is, how quickly and easily can we discover the problem so that we can continue delivering features faster and more confidently to our users?

How to Surface Relevant Performance Data

Your applications most likely consist of multiple components. These components could be written in different languages, with each individually instrumented with Sentry’s SDK. The goal of our tracing solution is to make sure developers get a full picture of the data captured within their tech stack. Tracing allows you to follow a request from the frontend all the way to your backend application and back.

OpenTelemetry Collector - What Is It?

Before we dive into the Collector, let’s cover the components that make up the OpenTelemetry project. If you missed it, our post What is OpenTelemetry gives a high level introduction to OpenTelemetry and the key components of OpenTelemetry project: The OpenTelemetry collector is optional when using a SaaS service like Scout. Even so, knowing what the Collector can do and when to use it is helpful to understand.

How OpenTelemetry Works Under the Hood in JavaScript

OpenTelemetry (OTel) is an open source selection of tools, SDKs and APIs, that allows developers to collect and export traces, metrics and logs. It’s the second-most active project in the CNCF, and is emerging as the industry standard for system observability and distributed tracing across cloud-native and distributed architectures. OTel supports multiple languages, like JavaScript, Java, Python, Go, Ruby and C++.

OpenTelemetry and Jaeger | Key concepts, features, and differences

OpenTelemetry and Jaeger are both open-source projects under Cloud Native Computing Foundation. In this article, let us understand the key concepts involved in both projects, their features, and their differences. OpenTelemetry is a vendor-agnostic instrumentation library. It provides a set of tools, APIs, and SDKs to create and manage telemetry data(logs, metrics, and traces). Jaeger is an open-source tool focused on distributed tracing of requests in a microservice architecture.

Context propagation in distributed tracing: Beyond "Hello World" examples

In our line of work, it’s not uncommon to encounter customers that have custom workflows or architectures that may not always support distributed tracing mechanisms. In development in general, we often have our beliefs on what should happen in theory and we rely on Hello-World examples, only to be surprised by what happens in reality. Our customers too sometimes have to build creative solutions to deal with unique situations – which then motivates us to build creative solutions as well.