Operations | Monitoring | ITSM | DevOps | Cloud
January 2023
Datadog's commitment to OpenTelemetry and the open source community
The OpenTelemetry (OTel) project is an open source initiative with the goal of providing vendor-neutral standards and tools that enable users to collect telemetry from any source in their environment and send it to any backend. A core tenet of Datadog is to provide a single, unified platform for customers to easily collect and monitor all of their observability data, regardless of where it comes from.
Complete Guide to Distributed Tracing with OpenTelemetry - Part I
Distributed tracing in Kubernetes apps: What you need to know
Kubernetes makes it easier for businesses to automate software deployment and manage applications in the cloud at scale. However, if you’ve ever deployed a cloud native app, you know how difficult it can be to keep it healthy and predictable. DevOps teams and SREs often use distributed tracing to get the insights they need to learn about application health and performance.
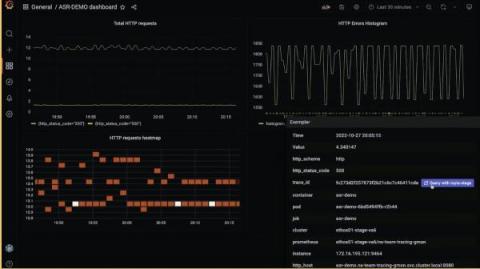
Learn how to use the common OpenTelemetry demo application with Sumo Logic
Why metrics, logs, and traces aren't enough
Unlock the full potential of your observability stack with continuous profiling Identifying performance bottlenecks and wasteful computations can be a complex and challenging task, particularly in modern cloud-native environments. As the complexity of cloud-native environments increases, so does the need for effective observability solutions.
Using distributed tracing to identify bottlenecks in your app flows
As an engineer building a distributed application, every now and then I need to look for and analyze bottlenecks in our system. There can be several triggers for conducting a bottleneck analysis, for example: In this blog post I’ll share how I’ve been using our own product, Helios, and the power of distributed tracing, to help pinpoint bottlenecks in our system and resolve them fast.
Reduce mean time to hello world with OpenTelemetry, Grafana Mimir, Grafana Tempo, and Grafana: Inside Adobe's observability stack
How is Grafana like an invisibility cloak? At Adobe, it’s one of just four tools they’re using to build observability directly into their CI/CD pipeline, making it essentially invisible — but nonetheless impactful — to thousands of developers across the organization who use it in their day-to-day lives.
3 Easy Ways to Get Started With Distributed Tracing
Not to put too fine a point on it, but we think distributed tracing gets a very bad rap for being too complicated and labor-intensive. We’re here to show you three ways you can jumpstart a distributed tracing effort, starting small and expanding as it makes sense. These examples involve only a little code and perhaps a bit of a mindset change. Starting small with distributed tracing can even be fun, because who doesn’t like getting customized results without much work?
Centralized Logging with Open Source Tools - OpenTelemetry and SigNoz
How OpenTelemetry Powers Observability @ Canva
Microservices Monitoring: Cutting Engineering Costs and Saving Time
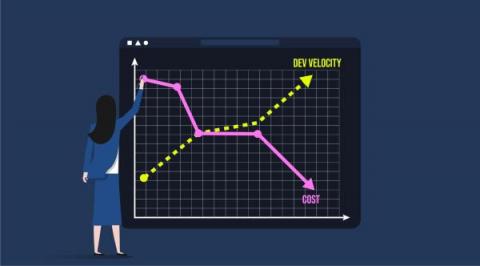
As businesses are planning for 2023, many are adopting a more conservative mindset when it comes to their resources. In light of the recent market fluctuations and the uncertainty of if and how a recession will affect them, they are looking for ways to cut costs and increase their efficiency. But despite the spending slowdown, development velocity can’t slow down.


