Operations | Monitoring | ITSM | DevOps | Cloud
April 2023
Coralogix Deep Dive - Tracking Every Interaction with Tracing and APM
Exploring OpenTelemetry Configuration in Ruby
OpenTelemetry is enabling a revolution in how Observability data is collected and transmitted. See our What Is OpenTelemetry post on why this is an important inflection point in the Observability space. In this post, we’ll walk through how to configure the OpenTelemetry Gems within a Rails app.
Before Taking the Plunge, Dip Your Toes in OTel
OpenTelemetry was launched in May 2019, as a merger of the OpenCensus and OpenTracing projects. The open-source, vendor-neutral project resides within the Cloud Native Computing Foundation (CNCF), which virtually ensures its longevity and widespread adoption. In fact, OpenTelemetry has gained significant traction in recent years, with support from many major cloud providers and the tech industry.
7 Quick Tips for Working with Traces in OpenTelemetry
Avoiding vendor lock-in is a ‘must’ when it comes to working with new services. Those in ITOps, DevOps, or as an SRE also don’t want to be tied to specific vendors when it comes to their telemetry data. And that’s why OpenTelemetry’s popularity has surged lately. OpenTelemetry prevents you from being locked into specific vendors for the agents that collect your data.
Announcing LM Exporter
Revolutionize Your Cloud-Native Deployments with CloudFabrix using Kubernetes and OpenTelemetry
Beyond Observability and Tracing: Doing More With The Data We Have
Observability is a term that has been thrown around a lot in the past few years in the software development industry. Different people use it in different ways, but one thing that is clear is that it attempts to provide a solution to a real pain engineers are feeling. It is the pain of not knowing what is happening in the microservices architecture and how and why systems are behaving in production.
Optimize Your Prisma Queries with AppSignal and OpenTelemetry
AppSignal integrates seamlessly with Prisma via OpenTelemetry to give you invaluable insights into how your application is performing. In this blog post, we'll outline how you can use AppSignal to optimize your application's Prisma integration, mitigate inefficient database queries, spot anomalies, and improve your application's scalability.
Elastic Common Schema and OpenTelemetry - A path to better observability and security with no vendor lock-in
At KubeCon Europe, it was announced that Elastic Common Schema (ECS) has been accepted by OpenTelemetry (OTel) as a contribution to the project. The goal is to achieve convergence of ECS and OpenTelemetry’s Semantic Conventions (SemConv) into a single open schema that is maintained by OpenTelemetry. This FAQ details Elastic’s contribution of Elastic Common Schema to OpenTelemetry, how it will help drive the industry to a common schema, and its impact on observability and security.
Lightstep from ServiceNow deepens commitment to OpenTelemetry project
At Lightstep, we’ve seen many organizations grapple with “cloud-native sticker shock” as they come to understand that these complex systems require sifting through massive amounts of data across architectures and proprietary solutions. In today’s macroeconomic environment, organizations are looking to reduce costs while driving innovation, especially when it comes to cloud-native applications.
A Guide to OpenTelemetry for .NET Engineers
Hey.NET engineers! Today, we’ll explore the world of OpenTelemetry, focusing on how it can benefit your.NET applications. We’ll talk about the strengths and weaknesses of OpenTelemetry, walk you through the setup process, discuss the basics, and share some best practices. Plus, we’ll touch on topics like auto-instrumentation, metrics, and more. So, let’s dive in!
Flexible OpenTelemetry data generation for effective testing (Part 1)
Our OpenTelemetry data generator provides a seamless product-validation experience across all teams working in AppDynamics Cloud. OpenTelemetry™ is a complete telemetry system for monitoring both modern, distributed architectures in the cloud and more traditional on-prem applications.
Flexible OpenTelemetry data generation for effective testing (Part 2)
In this second (and final) segment, we continue to show how our OpenTelemetry data generator provides a seamless product-validation experience across all teams working in AppDynamics Cloud. In the first part of this two-blog series, we provided a high-level overview of OpenTelemetry™ (or OTel). a complete telemetry system for monitoring both modern, distributed architectures in the cloud and more traditional on-prem applications.
OpenTelemetry-powered infrastructure monitoring: isolate and fix issues in minutes
OpenTelemetry Tracing: Everything you need to know
Applications are increasingly switching from the traditional monolithic design to a modern microservices-based design with several operational benefits. However, it also introduces challenges as conventional methods for collecting metrics and logs become ineffective due to the application design’s distributed nature.
Monitoring your Express application using OpenTelemetry
Monitor your Nodejs application with OpenTelemetry and SigNoz
OpenTelemetry Roundup for Kubecon EU
Well howdy there partner, Phillip here with a rootin’ tootin’ OTel update for ya, right on time for Kubecon EU!
OpenTracing via Jaeger
Within enterprises, it used to be that applications ran on a single server. Owners could directly monitor that discrete machine, conveniently access all the logs they needed, see all the metrics that mattered, and hit the reboot button, without needing to confer with “everyone.” Those days are gone. Modern application architectures stretch the definitions of the words “federated” and “distributed.” We now have distributed applications.
Distributed Tracing for AWS CDK Applications
The AWS CDK lets users build as Infrastructure as Code (IaC) reliable, scalable, and cost-effective applications in their cloud environments. With the AWS CDK, developers can use various supported programming languages to create constructs (reusable cloud components) and compose them together into stacks and applications.
Tracing Services Using OTel and Jaeger
Downloading and Configuring Prefix featuring OpenTelemetry
Fireside Chat: Prefix featuring OpenTelemetry
Introduction to Prefix Featuring OpenTelemetry
OpenTelemetry 101: A Non-Technical Guide to Starting Your Open Observability Journey
OpenTelemetry: Why community and conversation are foundational to this open standard
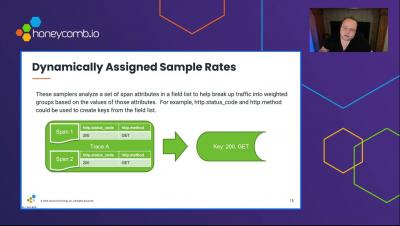
Successful Sampling With Refinery
How to Monitor Cloudflare with OpenTelemetry
Top Distributed Tracing Tools - Every Developer Should Know
Web applications have expanded over the past ten years to support millions of users and generate terabytes of data. Customers of these programmes anticipate quick responses and round-the-clock accessibility. When businesses adopt service-oriented architectures and give up monolithic workloads, they are stepping into the uncharted ground.
Ship OpenTelemetry Data to Coralogix via Reverse Proxy (Caddy 2)
It is commonplace for organizations to restrict their IT systems from having direct or unsolicited access to external networks or the Internet, with network proxies serving as gatekeepers between an organization’s internal infrastructure and any external network. Network proxies can provide security and infrastructure admins the ability to specify specific points of data egress from their internal networks, often referred to as an egress controller.
What is Context Propagation in Distributed Tracing?
Python OpenTelemetry - Walkthrough and monitoring Examples
Microservices architecture has become the new norm for modern applications due to its numerous advantages compared to traditional monolithic architecture. However, microservices also come with several challenges. Especially when it comes to observability, traditional monitoring tools and techniques can no longer handle microservices’ distributed and dynamic nature.
OpenTelemetry Python - Walkthrough and monitoring Examples
Python app monitoring and debugging can be challenging. Using distributed tracing and OpenTelemetry visualization minimizes MTTR and improves developer experience, as seen in this article.


