Operations | Monitoring | ITSM | DevOps | Cloud

June 2022

gRPC - Monitor gRPC calls with OpenTelemetry | Explained with a Go example

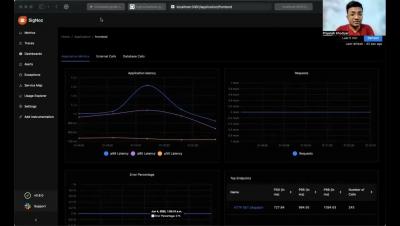
OpenTelemetry can only help in generating the telemetry data. In order to store, and analyze that data, you need to choose a backend analysis tool. In this article, we will monitor collected data from gRPC calls with SigNoz. SigNoz is a full-stack open-source APM tool that provides metrics monitoring and distributed tracing. It is built to natively support OpenTelemetry data formats. Hence, it’s a great choice for a backend analysis tool to combine with OpenTelemetry. On a side note, OpenTelemetry provides you the freedom to select a backend analysis tool of your choice.

Our commitment to being developer-focused just got real

I’m excited to share that today, we’re making Helios available to all developers around the world for free. Helios is a developer platform that helps increase dev velocity and productivity when building cloud-native applications. Over the past few months we’ve worked closely with dozens of private beta users to build a product that we believe will make a difference.

How to monitor Tomcat with OpenTelemetry

We are constantly working on contributing monitoring support for various sources, the latest in that line is support for Tomcat monitoring using the JMX Receiver in the OpenTelemetry collector. If you are as excited as we are, take a look at the details of this support in OpenTelemetry’s repo. You can utilize this receiver in conjunction with any OTel collector: including the OpenTelemetry Collector and observIQ’s distribution of the collector.

NextJS - Monitoring your NextJS application using OpenTelemetry and SigNoz

In this video, we demonstrate how to implement OpenTelemetry NextJS libraries for a sample NextJS application and then visualize the collected data in SigNoz. More about SigNoz: SigNoz - Monitor your applications and troubleshoot problems in your deployed applications, an open-source alternative to DataDog, New Relic, etc. Backed by Y Combinator. SigNoz helps developers monitor applications and troubleshoot problems in their deployed applications. SigNoz uses distributed tracing to gain visibility into your software stack.

Elixir - Monitor your Elixir Application with OpenTelemetry and SigNoz

SigNoz provides query and visualization capabilities for the end-user and comes with out-of-box charts for application metrics and traces. Now let’s get down to how to implement OpenTelemetry in your Elixir application. More about SigNoz: SigNoz - Monitor your applications and troubleshoot problems in your deployed applications, an open-source alternative to DataDog, New Relic, etc. Backed by Y Combinator.

Get actionable insights into your data pipelines with Helios

In distributed application environments, to solve problems in code you need to be able to connect the dots between all the different places where your code runs, including frameworks like Databricks and Apache Airflow. The Databricks pipeline may be one of the most crucial places where your code runs, but the visibility you’re getting there is limited.

Choosing an OpenTelemetry backend - Things to keep in mind

OpenTelemetry is a Cloud Native Computing Foundation(CNCF) incubating project aimed at standardizing the way we instrument applications for generating telemetry data(logs, metrics, and traces). However, OpenTelemetry does not provide storage and visualization for the collected telemetry data. And that’s where an OpenTelemetry backend is needed. Cloud computing and containerization made deploying and scaling applications easier.

How to send logs to Grafana Loki with the OpenTelemetry Collector using Fluent Forward and Filelog receivers

In this guide, we’ll set up an OpenTelemetry Collector that collects logs and sends them to Grafana Loki running in Grafana Cloud. We will consider two examples for sending logs to Loki via OpenTelemetry Collector. The first one shows how to collect container logs with a Fluent Forward receiver. The second one shows how to collect system logs with a Filelog receiver.

Ruby - Tracing a Ruby application with OpenTelemetry for performance monitoring

Tracing your application can give the much needed context required to troubleshoot performance issues. OpenTelemetry is an open-source project that can help you to set up an observability framework for your cloud-native applications. In this tutorial, we will use SigNoz as our backend analysis tool. SigNoz is a full-stack open-source APM tool that can be used for storing and visualizing the telemetry data collected with OpenTelemetry. It is built natively on OpenTelemetry and works on the OTLP data formats.

NestJS - Monitoring your NestJS Application using OpenTelemetry and SigNoz

Monitoring your NestJS application is critical for performance management. But setting up monitoring for NestJS applications can get cumbersome requiring multiple libraries and patterns. That's where OpenTelemetry comes in. In this tutorial, we will use SigNoz as a backend. SigNoz is an open-source APM tool that can be used for both metrics and distributed tracing. Let's get started and see how to use OpenTelemetry for a NestJS application.

Getting Started with OpenTelemetry for Observability

This article was published in The New Stack. For most developers, software development means there is an API for almost everything, hardware is provisioned via the cloud and the core focus is on building only the features most crucial to your business. Of course, all these integrations and modern distributed architectures create their own set of problems. Having full insight into your application has become even more important and is now commonly known as observability.

Filtering Metrics with the observIQ OpenTelemetry Collector

In this post, we will address the common monitoring use case of filtering metrics within the observIQ OpenTelemetry (OTEL) collector. Whether the metrics are deemed unnecessary, or they are filtered for security concerns, the process is fairly straightforward. For our sample environment, we will use MySQL on Red Hat Enterprise Linux 8. The destination exporter will be to Google Cloud Operations, but the process is exporter agnostic.

Automating Backend Testing in Microservices: Challenges and Solutions

Testing today’s environments is more challenging than it was a few years ago. The transition to distributed environments has created complexity, overhead, and friction when writing and running new backend tests. These tests require a lot of preparation, infrastructure building, and maintenance since many services communicate asynchronously and they often miss exceptions that are thrown on the “deeper layer” of the system architecture and it’s hard to make it testable.

OpenTracing vs. OpenTelemetry

Monitoring and observability have increased with software applications moving from monolithic to distributed microservice architectures. While observability and application monitoring share similar definitions, they also have some differences. The purpose of both monitoring and observability is to find issues in an application. However, monitoring aims to capture already known issues and display them on a dashboard to understand their root cause and the time they occurred.

Rust - Implementing OpenTelemetry in a Rust application for performance monitoring

In this tutorial, we will use OpenTelemetry to instrument a PHP application for telemetry data. OpenTelemetry can be used to trace Rust applications for performance issues and bugs. OpenTelemetry is an open-source project under the Cloud Native Computing Foundation (CNCF) that aims to standardize the generation and collection of telemetry data. Telemetry data includes logs, metrics, and traces. More about SigNoz.

How to monitor Elasticsearch with OpenTelemetry

Some popular monitoring tools in the market can complicate and create blind spots in your Elasticsearch monitoring. That’s why we made monitoring Elasticsearch simple, straightforward and actionable. Read along as we dive into the steps to monitor Elasticsearch using observIQ’s distribution of the OpenTelemetry collector. To monitor Elasticsearch we will configure two OpenTelemetry receivers, the elasticsearch receiver and the JVM receiver.

Installing and Configuring the OpenTelemetry Collector

The scope of the OpenTelemetry project encompasses how telemetry data is collected, processed, and transmitted. The OpenTelemetry project is not involved with how the data is stored, displayed, or used beyond the collection and transmission phases. The OpenTelemetry Collector is an application written in Go.

Implementing OpenTelemetry in React applications | Tutorial

More about SigNoz: SigNoz - Monitor your applications and troubleshoot problems in your deployed applications, an open-source alternative to DataDog, New Relic, etc. Backed by Y Combinator. SigNoz helps developers monitor applications and troubleshoot problems in their deployed applications. SigNoz uses distributed tracing to gain visibility into your software stack. If you need any clarification or find something missing, feel free to raise a GitHub issue with the label documentation or reach out to us at the community slack channel.

OpenTelemetry PHP | Monitoring a PHP application with OpenTelemetry

PHP is a widely popular server-side language and enjoys the top spot in terms of market share. Many world-famous organizations like Facebook have their applications written in PHP. WordPress, which powers 43% of all websites, is also built on PHP. In this tutorial, we will use OpenTelemetry to instrument a PHP application for telemetry data. It’s essential to monitor your PHP application for performance issues and bugs.

Replaying E2E flows across distributed applications - quickly and easily

Within the technology stack used by developers today you would be hard-pressed not to find products and features that save time. Time-saving tools are crucial for developers because we look for ways to deliver production-ready code faster to keep up with the demands of our users and customers. We want to be able to identify, reproduce, and fix issues – fast.

Introducing the Mezmo Exporter for OpenTelemetry

At Mezmo, we see a massive opportunity to reduce Mean Time to Detection (MTTD) and Mean Time to Resolution (MTTR) by making log data more valuable and actionable. Today, we’re thrilled to announce the release of the Mezmo Exporter for OpenTelemetry- the first step in our continued work with the project to further simplify the ingestion of log data and make that data more actionable with enrichment of key OpenTelemetry attributes.

Tracing errors and surfacing collateral damage across your code base

Frontend technologies typically talk to several services in your backend, and those services talk to other services. At the root of every issue is a single event that causes a domino effect. A domino effect that impacts every operation from the first experience on the frontend to the backend API call. Sentry can show you how these exceptions and latency issues impact every one of your services. For example, take the ever common and seemingly simple to resolve 500 - Internal Server Error.

OpenTelemetry in a C# .NET application | Implementation guide

C# (pronounced C-Sharp) is a simple, modern, object-oriented, and type-safe programming language. ASP.NET is one of the top frameworks for building modern applications using C#, F#, or Visual Basic. OpenTelemetry is one of the popular CNCF projects. Some other notable projects under CNCF include Kubernetes, Helm, and Fluentd. The OpenTelemetry project aims to create an open source web standard for instrumenting cloud-native applications.