Operations | Monitoring | ITSM | DevOps | Cloud
Tracing
The latest News and Information on Distributed Tracing and related technologies.
NodeJS Instrumentation - Adding Analyzed Spans for Improved Data Analytics | Datadog Tips & Tricks
Modifying a Span Using Hooks -- an Example in Node.js
Generating Jaeger gRPC services and using Jaeger in JUnit with Testcontainers
In this article you will learn how to generate Jaeger model classes and gRPC services from protobuf definitions. The generated code can be used to write integrations or it can be used in tests to query tracing data from Jaeger-query service. This is the use case we are going to look at in more detail.
Locate failures in the application transaction path across platforms with distributed tracing
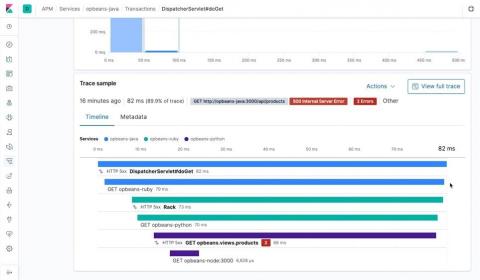
Elastic APM adopts W3C TraceContext
Distributed tracing remains one of the most important features of any tracing system. Nearly a year ago, we announced Elastic APM distributed tracing, let’s take a look at how this useful feature works behind the scenes. Over the past few years, many applications have adopted microservice architecture. Each of the services in a microservice architecture can have their own instrumentation to provide observability into the service.
From distributed tracing to distributed profiling with Elastic APM
Distributed tracing is great — it helps you identify (micro)services within complex architectures having issues interfering with user experience, such as high latency or errors. But once a problematic service is identified, it can be difficult to find out which methods are to blame for the slowdown. Well, we have some big news to share for our Elastic APM users within the Java ecosystem.
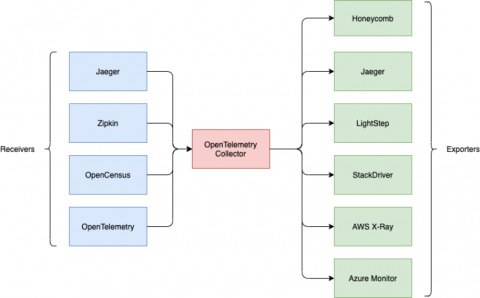
OpenTelemetry: New Honeycomb Exporters
We’re really big fans of OpenTelemetry at Honeycomb. As we’ve blogged about before, OpenTelemetry is the next phase of the OpenTracing and OpenCensus projects. Instead of working on separate but similar efforts, those two projects have merged to create OpenTelemetry. This is wonderful for the larger community as it gives people a clear way to instrument their code for metrics and traces that isn’t specific to any tool or vendor. OpenTelemetry is a CNCF sandbox project.
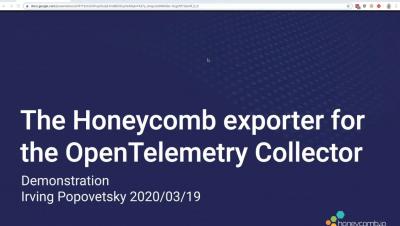
Honeycomb OpenTelemetry Collector Demo
JavaScript Tracing: How to Find Slow Code
Finding slow JavaScript code can be a tricky problem to solve. Small code changes can have a big impact on the performance of your code. Fortunately, many different approaches can help you nail down the exact source of the problem. In this post, you’ll learn about three methods that’ll bring you the results you’re seeking. You can trust manual code inspection, but that has its disadvantages.


