Operations | Monitoring | ITSM | DevOps | Cloud
November 2023
How to Monitor MongoDB Metrics with OpenTelemetry
Memcached Metrics Monitoring with OpenTelemetry
Challenges with Traditional SCA Tools
Application security testing tools are designed to ensure that applications are put through rigorous security assessments to identify security flaws within the application and its code. Even though applications are tested thoroughly (in static and dynamic ways), attackers always seem to find new ways of compromising them.
Enhance your visibility into OTel-instrumented apps in AWS Lambda
Enabling auto-instrumentation for your Lambda functions provides detailed insights into the performance and security of your serverless applications. Developers often also use custom instrumentation to fine-tune visibility and further tailor telemetry to their business needs. However, different teams within your organization might use a variety of instrumentation libraries, and achieving more granular visibility can come at the expense of data portability and interoperability.
Jaeger vs Zipkin: The Complete Comparison Guide
To monitor and troubleshoot the performance of microservice-based applications, Jaeger and Zipkin are examples of the most commonly used open-source distributed tracing systems. They both supply users with insight into the flow of requests through various components of a system, which can be utilized to find latency bottlenecks, errors, and performance problems in the system.
How to Monitor MySQL Metrics with OpenTelemetry
How to Collect .NET Application Logs with OpenTelemetry
How to Monitor Prometheus Metrics with OpenTelemetry Collector?
How to Monitor Apache Server Metrics with OpenTelemetry
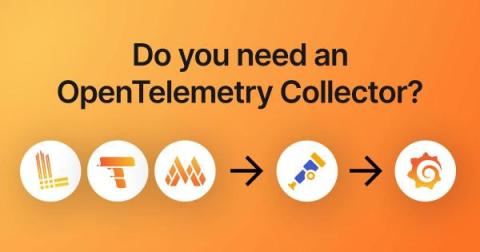
Do you need an OpenTelemetry Collector?
When you use OpenTelemetry SDKs to collect logs, metrics, and traces from infrastructure or an application, you’ll find many references to people using Grafana Agent and OpenTelemetry Collector. They start with an application or infrastructure that sends telemetry, and that data is sent to a collector, which then sends it to a backend like Grafana that may perform many functions, including visualization.
The Leading Jaeger Dashboard Examples
Unlocking the full potential of observability and tracing in modern software ecosystems has become imperative for businesses striving to deliver improved reliability and user experience. In this comprehensive roundup, we will dive into the world of Jaeger-incorporated observability and tracing dashboards, offering a curated selection of the best use cases that empower DevOps teams, engineers, and developers to gain unparalleled insights into the inner workings of their applications.
How Pipedrive switched its observability stack to OpenTelemetry & LGTM | ObservabilityCON 2023
OpenTelemetry Java Tutorial | Auto-Instrument Java App with OpenTelemetry
OpenTelemetry Operator Complete Guide [OTel Collector + Auto-Instrumentation Demo]
Announcing the Splunk Add-on for OpenTelemetry Collector
The Grafana OpenTelemetry Distribution for Java: Optimized for Application Observability
The OpenTelemetry project provides many different components and instrumentations that support different languages and telemetry signals. However, new users often find it hard to pick the right ones and configure them properly for their specific use cases. For this reason, OpenTelemetry defines the concept of a distribution, which is a tailored and customized version of OpenTelemetry components. Here at Grafana Labs, we are all-in on OpenTelemetry.
The Grafana OpenTelemetry Distribution for .NET: Optimized for Application Observability
The OpenTelemetry project provides many different components and instrumentations that support different languages and telemetry signals. However, new users often find it hard to pick the right ones and configure them properly for their specific use cases. For this reason, OpenTelemetry defines the concept of a distribution, which is a tailored and customized version of OpenTelemetry components. Here at Grafana Labs, we are all-in on OpenTelemetry.
OpenTelemetry Webinars - The Trace API
The Challenges of Collecting Runtime Data
Collecting data in real-time plays a crucial role in securing, monitoring, and troubleshooting applications. This real-time data, often referred to as ‘runtime data,’ provides unique insights into the application’s behavior, which aren’t available through other collection techniques. But the tricky part is that collecting runtime data comes with challenges.
Unlocking Open Telemetry for Golang
Open Telemetry (OTel) is an open source observability framework that has garnered significant attention for its powerful capabilities in monitoring metrics, logs and traces.. It is second only to Kubernetes in the CNCF velocity chart with contributions being made from major players in the cloud industry, and has a growing community helping build out a thriving ecosystem.
3 Tips to Supercharge Your Application Tracing
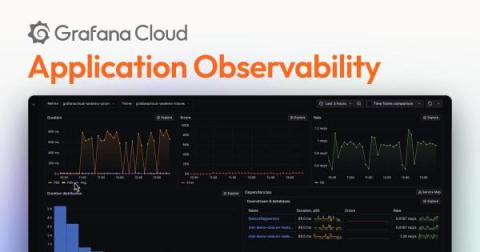
Announcing Application Observability in Grafana Cloud, with native support for OpenTelemetry and Prometheus
The Grafana LGTM Stack (Loki for logs, Grafana for visualization, Tempo for traces, and Mimir for metrics) offers the freedom and flexibility for monitoring application performance. But we’ve also heard from many of our users and customers that you need a solution that makes it easier and faster to get started with application monitoring.
Distributed Tracing: Your Ultimate Guide
What is OpenTelemetry? A Comprehensive Guide
An Essential Guide to OpenTelemetry In today’s expeditious, highly distributed software landscape, achieving true observability is no simple task. As you strive to understand how your applications and services perform and behave, you face multiple challenges. Moreover, you need to instrument applications and services that generate data effectively, have a reliable means to transmit it, and, most importantly, find a way to visualize and derive insights from it.
OpenTelemetry vs. OpenCensus
Simplify OpenTelemetry Pipelines with Headers Setter
In telemetry jargon, a pipeline is a directed acyclic graph (DAG) of nodes that carry emitted signals from an application to a backend. In an OpenTelemetry Collector, a pipeline is a set of receivers that collect signals, runs them through processors, and then emits them through configured exporters. This blog post hopes to simplify both types of pipelines by using an OpenTelemetry extension called the Headers Setter.
Helios Runtime for AppSec: The missing link in application security
Modern development teams increasingly rely on open-source packages to rapidly build and deploy applications. In fact, most, if not all applications consist of far more open-source and 3rd-party code than the code that’s written by their dev teams.
What Is OpenTelemetry? A Complete Introduction
APM vs Tracing vs Observability
Application Performance Monitoring (APM), tracing, and observability are fundamental software development and system management approaches. Each of these three concepts uniquely ensures that your applications operate, efficiently, smoothly, and reliably. Your organisation will more than likely already adopt one of these approaches, or even two, potentially all three.


