Operations | Monitoring | ITSM | DevOps | Cloud

Tracing

The latest News and Information on Distributed Tracing and related technologies.

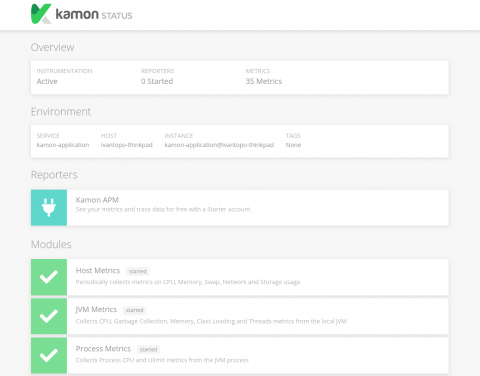
Kamon Just Got a Lot Easier to Use, Welcome Kamon 2.0!

Dear community, Kamon 2.0 is out and ready to roll! For this release we focused primarily on simplifying the installation proces and making sure that the core APIs are more solid and user friendly, since they will be the foundations upon which we will instrument the whole JVM world in the months to come!

Using Elasticsearch Rollover to manage indices

In this article you will learn how to configure and use the Elasticsearch rollover feature in Jaeger. Note that this feature has been introduced in Jaeger 1.10.0. Jaeger uses index-per-day pattern to store its data to Elasticsearch. It creates a new index for each day based on span’s timestamp. These indices have to be periodically removed by jaeger-es-index-cleaner cron job. Typically users keep data from one week up to one month which results in 7 or 30 indices only for spans.

Getting started with Jaeger to build an Istio service mesh

Service mesh provides a dedicated network for service-to-service communication in a transparent way. Istio aims to help developers and operators address service mesh features such as dynamic service discovery, mutual transport layer security (TLS), circuit breakers, rate limiting, and tracing. Jaeger with Istio augments monitoring and tracing of cloud-native apps on a distributed networking system.

Grafana Labs Teams Use Jaeger to Improve Query Performance Up to 10x

Grafana Labs works everyday to break traditional data boundaries with metric-visualization tools accessible across entire organizations. It began as a pure open-source project and has since expanded into supported subscription services. The Grafana open-source project is a platform for monitoring and analyzing time series data. There are also subscription offerings such as the supported Grafana Enterprise version. Grafana Labs’ engineers service more than 150,000 active installations.

Distributed Tracing with Jaeger and the ELK Stack

Over the past few years, and coupled with the growing adoption of microservices, distributed tracing has emerged as one of the most commonly used monitoring and troubleshooting methodologies. New tracing tools and frameworks are increasingly being introduced, driving adoption even further. One of these tools is Jaeger, a popular open source tracing tool. This article explores the integration of Jaeger with the ELK Stack for analysis and visualization of traces.

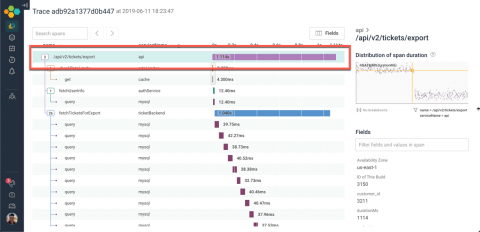
Investigating Timeouts with Tracing

Tracing is one of the key tools that Honeycomb offers to make sense of data. Over the last few weeks, we’ve made a number of improvements to our tracing interface — and, put together, those changes let you think about traces in a whole new way! Tracing makes it easier to understand control flow within a distributed system. We render traces with waterfall diagrams, which capture the execution history of individual requests.

Introducing Distributed Tracing with Zipkin with Logz.io

Distributed tracing has become a de-facto standard for monitoring distributed architectures, helping engineers to pinpoint errors and identify performance bottlenecks. Zipkin is one of the popular open source “tracers” available in the market, and I’m now happy to inform our users that we’ve recently introduced a new integration that allows users to easily ship trace data collected by Zipkin to Logz.io!

Jaeger and OpenTelemetry

Recently, OpenTelemetry has been announced as a new CNCF sandbox project resulting from a merger of OpenTracing and OpenCensus [1], [2], [3], [4]. Several people have already asked me what OpenTelemetry means for the Jaeger project (incubating at CNCF), and whether it is going to replace Jaeger. I will attempt to answer these questions in this post.