Operations | Monitoring | ITSM | DevOps | Cloud
June 2023
How we combined OpenTelemetry traces with Prometheus metrics to build a powerful alerting mechanism
One of the qualities of engineering team excellence is thinking outside the box to find creative solutions to hard problems. It’s our responsibility, as dev leaders, to pass on to the next generations of developers tips and tricks to help them look beyond the surface to solve complex business problems and leverage the power of the open source community, when possible.
How to Trial Honeycomb and OpenTelemetry
Insightful proof-of-concepts with a tool can be difficult to undertake due to the demands on valuable resources: time, energy, and people. With a task as grand as observability, how could one truly test if Honeycomb and OpenTelemetry are right for their organization and meet their requirements? For this thought experiment, here’s a comprehensive description of the ideal product evaluation over the course of four weeks, given unlimited resources.
3 models for logging with OpenTelemetry and Elastic
Arguably, OpenTelemetry exists to (greatly) increase usage of tracing and metrics among developers. That said, logging will continue to play a critical role in providing flexible, application-specific, event-driven data. Further, OpenTelemetry has the potential to bring added value to existing application logging flows.
OpenTelemetry .NET Distributed Tracing - A Developer's Guide
Modern applications are becoming increasingly distributed due to a wide range of benefits including enhanced scalability, high availability, fault tolerance, and better geographical distribution. But it also makes the overall system complex making it challenging to understand how they function internally. Distributed tracing helps to address it by tracking how requests flow through various system components with detailed insights.
Trace exemplars now available in Managed Service for Prometheus
Connect your metrics to your traces with exemplars to quickly troubleshoot and resolve latency issues.
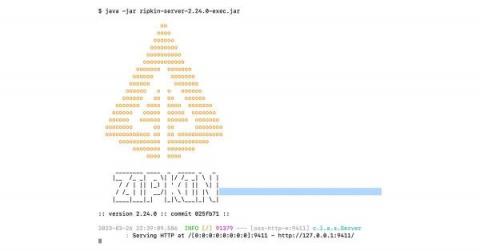
Perform Distributed Tracing with Zipkin
Open source Zipkin offers a robust set of features that make it easier for developers to understand and optimize complex distributed systems. Distributed tracing is a technique you can use to trace and monitor requests propagating through a distributed system. It can work in environments where multiple services process a request, making it an essential tool for modern microservices architectures. Zipkin is an open source distributed tracing system for monitoring and troubleshooting complex systems.
Introduction to Collecting Traces with OpenTelemetry
OpenTelemetry (also abbreviated as OTEL) is an increasingly popular open-source observability platform under the Cloud Native Computing Foundation (CNCF), which is currently the most active project in the CNCF after Kubernetes. It was created to establish a unified and vendor-agnostic way for instrumenting, collecting, and exporting telemetry data for your system and application across traces, logs, and metrics.
OpenTelemetry Security: How To Keep Telemetry Data Safe
Cloud Native Application Observability - Trace-Logs Correlation
What are Connectors in OpenTelemetry?
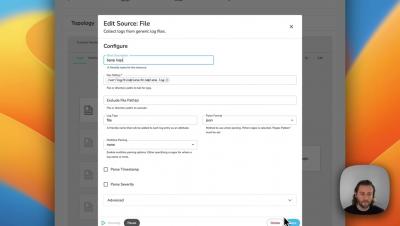
Short Descriptions in BindPlane OP
Serverless observability, monitoring, and debugging - Overview and best practices
Serverless, as you may already know, is a cloud computing model where the cloud provider dynamically manages and allocates resources to execute code without the need for server provisioning or infrastructure management on the developer. This article overviews serverless observability, monitoring, and debugging, based on distributed tracing and OpenTelemetry (OTel).
Correlation between logs and traces and vice versa
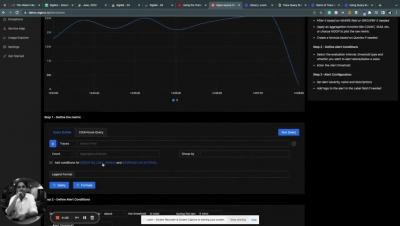
Demo of Trace Query Builder
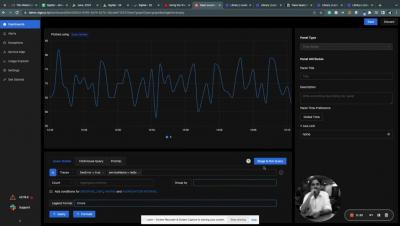
Query Builder for Traces and Logs in Alerts Tab
Logit.io Launches Platform Release With Latest OpenSearch Features
What is OpenTelemetry
Learn what is OpenTelemetry: The open-source observability framework for collecting and processing telemetry data from applications and systems.
Best Practices for using Amazon Distro for OpenTelemetry | Last9 Community Talks
Collecting Kubernetes Data Using OpenTelemetry
Running a Kubernetes cluster isn’t easy. With all the benefits come complexities and unknowns. In order to truly understand your Kubernetes cluster and all the resources running inside, you need access to the treasure trove of telemetry that Kubernetes provides. With the right tools, you can get access to all the events, logs, and metrics of all the nodes, pods, containers, etc. running in your cluster. So which tool should you choose?
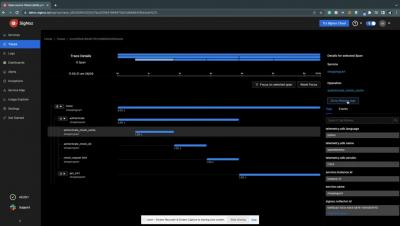
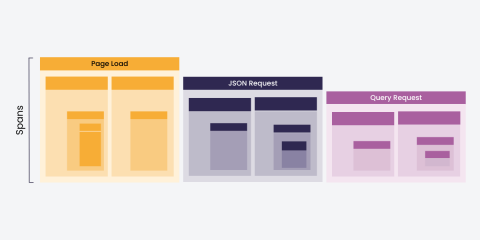
What are Spans in Distributed Tracing?
In modern software development, distributed systems have become increasingly common. As systems grow more complex and distributed, it can be challenging to understand how requests or messages move through the system and where bottlenecks may occur. This is where distributed tracing comes in. Distributed tracing is a technique that allows developers and operators to monitor and understand the behavior of complex systems.
Complete Guide to tracing Kafka clients with OpenTelemetry in Go
An open source OpenTelemetry APM | SigNoz
Monitoring your Nextjs application using OpenTelemetry
API monitoring vs. observability in microservices- Troubleshooting guide
Monitoring APIs through enhanced observability has gained traction with the popularity of microservices. Since microservice applications are built as independent and scalable modules, the number of microservices can grow dramatically as the application grows, increasing the complexity drastically. Since APIs work as the connective tissue between microservices, the number of APIs also grows in parallel.


