Operations | Monitoring | ITSM | DevOps | Cloud
July 2021
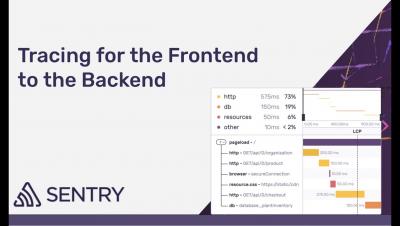
Tracing for the Frontend to the Backend
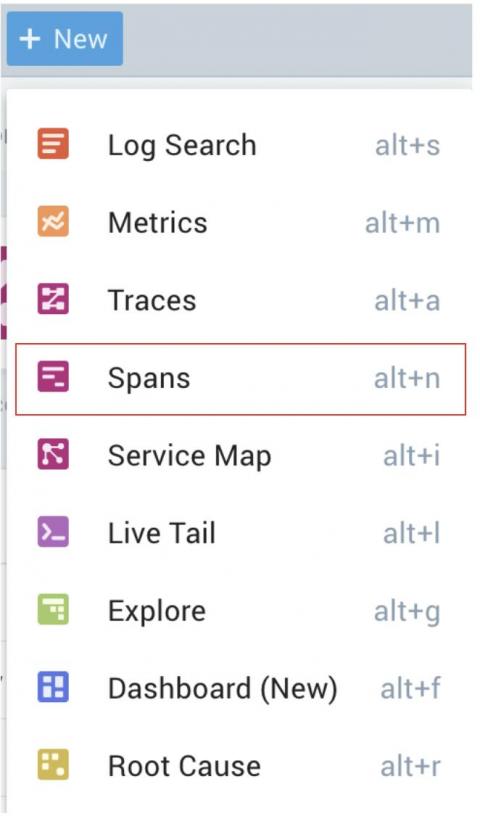
Queryless vs. Query-less. Faster Insights and Better Observer Experience with Span Analytics
The Ops Agent is now GA and it leverages OpenTelemetry
Running and troubleshooting production services requires deep visibility into your applications and infrastructure. While basic logs and metrics are available out of the box with Google Cloud Compute Engine (GCE), capturing advanced data used to require the installation of both a metrics agent and a logging agent.
Understanding and Debugging Applications Using Traces
An Introduction to OpenTelemetry
The growth of technology has led to more efficient and relevant digital experiences, and customers continue to expect more out of those interactions. That’s true no matter their location and no matter which device they choose to use. Companies that cannot provide these kinds of personalized interactions for their customers find themselves falling behind the competition as technology continues to advance.
How Slack Transformed Their CI With Tracing
Slack experienced meteoric growth between 2017 and 2020—but that level of growth came with growing pains. In his talk at the 2021 o11ycon+hnycon, Frank Chen (LinkedIn), a Slack Senior Staff Engineer, detailed one of Slack’s biggest pain points in that period: flaky tests. A flaky test returns both a passing and failing result despite no changes in the code. At one point, between 2017 and 2020, Slack’s flaky test rate reached as high as 50%.
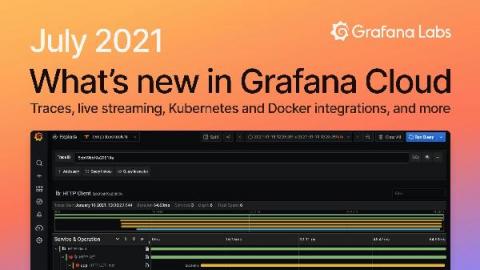
What's new in Grafana Cloud for July 2021: Traces, live streaming, Kubernetes and Docker integrations, and more
If you’re not already familiar with it, Grafana Cloud is the easiest way to get started observing metrics (Prometheus and Graphite), logs (Grafana Loki), traces (Grafana Tempo), and dashboards. Here are the latest features you should know about!
Distributed Tracing for Kafka Clients with OpenTelemetry and Splunk APM
This blog series is focused on observability into Kafka based applications. In the previous blogs, we discussed the key performance metrics to monitor different Kafka components in "Monitoring Kafka Performance with Splunk" and how to collect performance metrics using OpenTelemetry in "Collecting Kafka Performance Metrics with OpenTelemetry." In this blog, we'll cover how to enable distributed tracing for Kafka clients with OpenTelemetry and Splunk APM.


