Operations | Monitoring | ITSM | DevOps | Cloud
July 2023
Ingest OpenTelemetry metrics with Prometheus natively
Native support for OpenTelemetry metrics in Prometheus.
Implementing OpenTelemetry in a Gin application
Simplify managing Grafana Tempo instances in Kubernetes with the Tempo Operator
I’ve been working with Grafana Tempo for about half a year now, and one thing I like about it is that Tempo requires only object storage for storing traces, which is easy to set up in both cloud environments and on-premises. Another outstanding feature is TraceQL, which allows searching for relevant traces with a powerful query language.
Navigating the Serverless Landscape: Lessons from our Tracing Collector API Journey
In the previous blog in this series, we delved into the redesigned architecture of Amazon Prime Video and how they integrated different architectural styles for optimal performance and cost efficiency. We also discussed the impact of Amazon’s decision on the concept of a “serverless-first” mindset, highlighting the importance of considering alternative architectural approaches based on specific use cases and requirements.
OpenTelemetry for dummies: ELI5
What is OpenTelemetry? Why is it important? Do SREs need to adopt OTel? An Explain It Like I'm 5.
Harnessing Distributed Tracing for Application Performance Optimization
Distributed tracing is a powerful technique that allows you to track the flow and timing of requests as they navigate through a system. By linking operations and requests between multiple services, distributed tracing provides valuable insights into system performance and helps identify bottlenecks. In this blog post, we will delve into the benefits of distributed tracing, explore its relevance for various application architectures, and uncover how it operates behind the scenes.
OpenTelemetry vs. Prometheus
OpenTelemetry vs. Prometheus - Difference in architecture, and metrics.
Enhancing Observability Through Open Telemetry, industry trends and gaps to be considered
Exploring the New Trace Explorer Page - SigNoz
SigNoz Community Call - Using OpenTelemetry Collector Processor
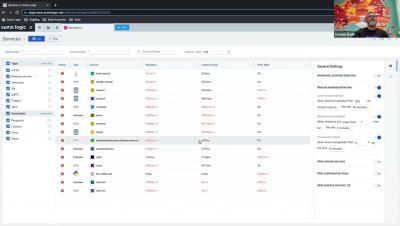
Service Map for Tracing - Sumo Logic Customer Brown Bag - Observability - July 25th, 2023
Understanding APM: How to add extensions to the OpenTelemetry Java Agent
As an SRE, have you ever had a situation where you were working on an application that was written with non-standard frameworks, or you wanted to get some interesting business data from an application (number of orders processed for example) but you didn’t have access to the source code?
How we slashed detection and resolution time in half (Salt Security)
Salt Security had deployed OpenTelemetry but found it insufficient. So the company engineers evaluated Helios, which visualizes distributed tracing for fast troubleshooting. My role as the Director of Platform Engineering at Salt Security lets me pursue my passion for cloud-native tech and for solving difficult system-design challenges. One of the recent challenges we solved had to do with visibility into our services. Or lack thereof.
Debugging and troubleshooting microservices in production-All you need to know
What do you do when things break in production? Debugging microservices isn’t a walk in the park. Microservices are designed to be loosely coupled, which makes them more scalable and resilient, but also more difficult to debug. When a problem occurs in a microservices app, it can be difficult to track down the source of the problem. When the problem is in production, the clock is ticking and you have to resolve the issues fast.
OpenMetrics vs OpenTelemetry - How to choose?
OpenTelemetry vs Prometheus
How to Instrument a Legacy Mule App with OpenTelemetry
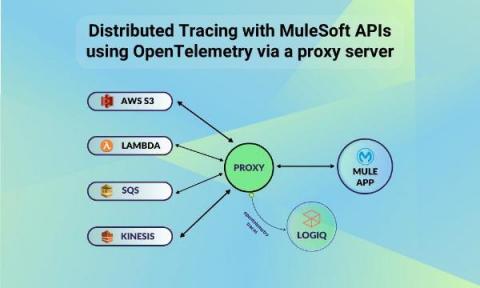
In the previous article, we talked about Distributed Tracing with MuleSoft APIs using OpenTelemetry. In this post, we’ll go through the process of integrating Distributed Tracing with MuleSoft APIs using OpenTelemetry via a proxy server. The purpose of this article is to demonstrate how we can instrument a legacy mule app with open telemetry without making changes to the existing app. Here, we’re showing an example of getting data from a header as well as a query parameter.
What is OpenTelemetry Collector
What is OpenTelemetry Collector, Architecture, Deployment and Getting started.
Observing Core Web Vitals with OpenTelemetry
Core Web Vitals (CWV) are Google's preferred metrics for measuring the quality of the user experience for browser web apps. Currently, Core Web Vitals measure loading performance, interactivity, and visual stability. These are the main indicators of what a user’s experience will be while using a web page.
How to combine OpenTelemetry instrumentation with Elastic APM Agent features
Elastic APM supports OpenTelemetry on multiple levels. One easy-to understand scenario, which we previously blogged about, is the direct OpenTelemetry Protocol (OTLP) support in APM Server. This means that you can connect any OpenTelemetry agent to an Elastic APM Server and the APM Server will happily take that data, ingest it into Elasticsearch®, and you can view that OpenTelemetry data in the APM app in Kibana®.
Lambda monitoring: Combining the three pillars of observability to reduce MTTR
Observability & monitoring can be challenging when it comes to distributed applications, serverless architectures being a typical examples of that. As with any other service that we run, we need to understand how our Lambda functions are executed, how to identify issues, and how to optimize performance.
Should you DIY your Opentelemetry Monitoring?
10 Essential Distributed Tracing Best Practices for Microservices
If you are a SaaS provider making an application that deals with, say, a health registry or some personal information of the public, you realize how crucial it is to maintain their confidentiality. It is these situations that demand a previous encryption of data followed by a prompt tracing mechanism that finds out the faults right at the moment or prior to its occurrence. And what better way to keep track of your application than tracing?
Distributed Tracing with MuleSoft APIs using OpenTelemetry
Distributed tracing enhances observability by providing detailed insights into the performance, behavior, and dependencies of your distributed system. It empowers you to proactively identify and resolve issues, optimize performance, and deliver a reliable and high-performing application.
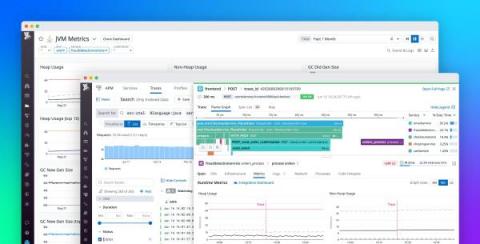
Monitor runtime metrics from OTel-instrumented apps with Datadog APM
OpenTelemetry (OTel) is an open source, vendor-neutral observability framework that supplies APIs, SDKs, and tools for the instrumentation of applications and services. As part of our ongoing commitment to OTel, we are excited to announce support for the ingestion and visualization of runtime metrics from OTel-instrumented applications in Java, .NET, and Go.
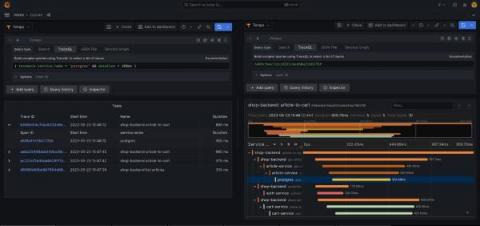
Distributed tracing for testing with Grafana Tempo and Tracetest (Grafana Office Hours #05)
API latency in microservices - Trace based troubleshooting
In microservices architectures, apps are broken down into small, independent services that communicate with each other using APIs in a synchronous or asynchronous way.
Distributed Tracing in a nutshell | Snack of the Week
New Service Graph Connector brings open-source data to the workspace
Since ServiceNow launched the Service Graph Connector for OpenTelemetry in the Innovation Lab in April 2023, we’ve seen customers use it in pre-production environments. Today, I’m excited to announce that the Service Graph Connector for OpenTelemetry is generally available for production. Service Graph Connectors allow customers to load large volumes of data quickly and easily into their configuration management database (CMDB).


