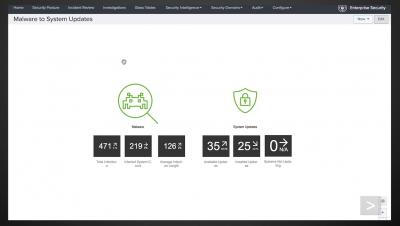
Splunk Enterprise Security: Glass Tables
Watch how Glass Tables in Splunk Enterprise Security can be customized to create dashboards and visualizations specific to your security environment.


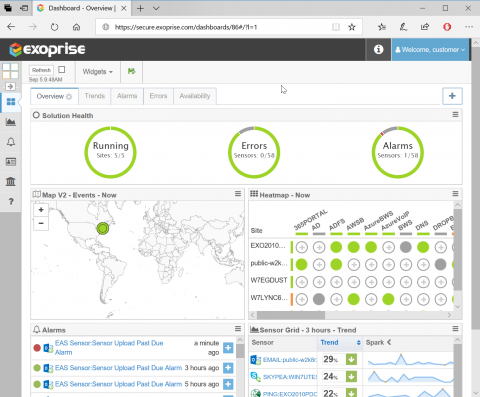
CloudReady dashboards enable a great degree of customization, a wide array of widgets, and the ability to build visualizations for monitoring the health, availability, and performance of all of your SaaS apps — especially Office 365. If you’re going to build a dashboard for all of your cloud/SaaS apps you want to be able to customize and get it just right for the different teams within your organization.
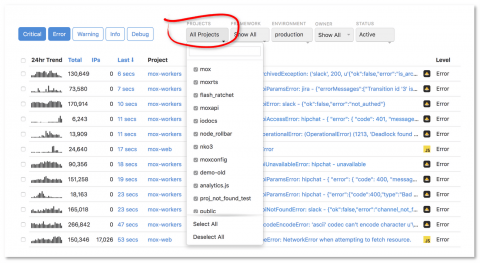
Increasingly more software teams - ourselves and our customers included - are adopting practices like microservices and/or Continuous Delivery. We built the All Items View to make error monitoring much easier for those using Rollbar in such ways.
Today we are releasing Grafana 5.2.3 and Grafana 4.6.4. These patch releases includes a very important security fix for all Grafana installations which are configured to use LDAP or OAuth authentication.
This week we highlight articles featuring the ultimate guide to monitoring Kubernetes using Prometheus and Grafana, how to build effective dashboards, and a guide to help demystify PromQL.
August is flying by, but hopefully there’ll still be time to enjoy a few more summer evenings. This week we’re sharing the video demoing the new Explore UI in Grafana from last week’s PromCon, monitoring VMWare’s VKE with Prometheus, hosting a blog on a budget and more.
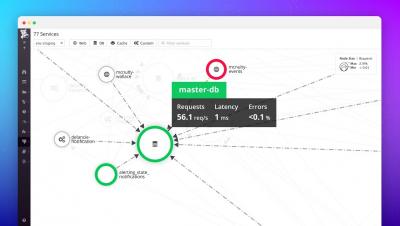
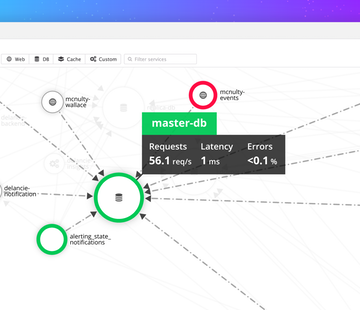
When your pager goes off at 3:00 a.m. and you need to begin your investigation, where do you start? Before you can attack the problem, you need to know the lay of the land: What else is potentially affected by this failing service? What are its dependencies? Where are the probable root causes? With the new Datadog Service Map, you can visualize the topology of your application to answer these questions and more.