GrafanaCon EU 2018: Grafana at CERN
This presentation will give an overview of the growing success of Grafana at CERN with some examples of monitoring solutions and technologies used for the different applications at CERN.


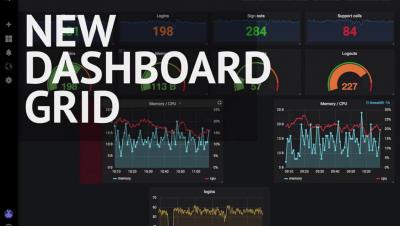
Dashboards are pages which can show all your StatusCake operations in one place, from your uptime tests to your virus scans, making them a great tool for internal teams to get an instant view of service status as a whole. Once generated the page will be fully optimised to fit nicely on large office monitors.