Operations | Monitoring | ITSM | DevOps | Cloud

Featured Post

Monitoring CloudNativePG: What Changes When the Operator Owns Your Logs

Postgres operators like CloudNativePG (CNPG) have lowered the threshold for running highly available Postgres clusters on Kubernetes. Failover, replicas, backups, and rolling upgrades are handled by the operator, along with helpful niceties like automatic configuration of essential extensions. A few changes to a YAML manifest can provide a lot of value very quickly.
What's new and coming in Redgate Monitor: AI, CIS compliance and cloud migration

This webinar covers what's new and coming in Redgate Monitor: AI with Redgate Assistant and the Redgate Monitor MCP server, CIS benchmark compliance checks and security alerting (Enterprise), AWS cloud migration advice for SQL Server workloads, and the roadmap into 2027. Redgate Monitor has shipped a lot this year, and there's more landing before the end of it. This session walks through what's new, what's coming over the next few months and into 2027, and what it all means for how you run your estate. Roadmap items are current direction, not commitments.

Observability Lessons NVIDIA and CoreWeave

The best thing that can happen to an open-source project is to find its way into some of the world’s largest technology companies. In September 2026, this happened twice in one week: VictoriaMetrics is now officially bundled in the self-managed edition of NVIDIA’s Cloud Functions, and I learned that CoreWeave is using VictoriaMetrics as the metrics backend for all of its infrastructure customers. Both companies adopted VictoriaMetrics independently.

Devart ODBC Drivers update brings SQL Server 2025, MySQL 9.7, and new Snowflake authentication methods

The latest release of Devart ODBC Drivers is here, bringing support for Microsoft SQL Server 2025, MySQL 9.7.x, and NexusDB 4.75.20, along with new authentication methods, advanced data protection features, and improved compatibility with development tools and operating systems.

Go, Logs and the Engineering Behind VictoriaLogs Performance

What actually makes a logging system fast? That was the question behind Tech Talk. And if you were expecting the answer to be a collection of clever Go optimizations, Jesús Espino, Principal Engineer at VictoriaMetrics, made an important point pretty early in our conversation: A huge part of VictoriaLogs’ performance comes from architecture and data structures. The micro-optimizations come later. Now that gave my Tech Talk partner in crime, Mathias Palmersheim, and me plenty to dig into.

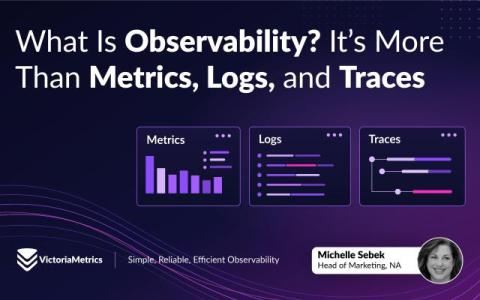
What Is Observability? It's More Than Metrics, Logs, and Traces

Modern systems, due to their distributed nature, rarely fail in simple ways. A request might pass through an API gateway, several microservices, a database, a message queue, and a third-party service before a response ever reaches a user. When something slows down or breaks, knowing that something is wrong is only the beginning. You need to figure out.

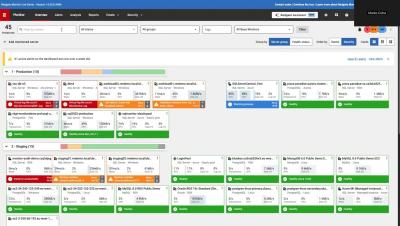
Is Redgate Monitor a multi-platform tool or SQL Server only?

Redgate Monitor is a multi-platform database monitoring tool, not a SQL Server only tool. It monitors SQL Server, PostgreSQL, Oracle, MySQL and MongoDB from a single dashboard, on premises or in the cloud. This demo shows SQL Server, PostgreSQL and Oracle instances in the Redgate Monitor live demo environment.

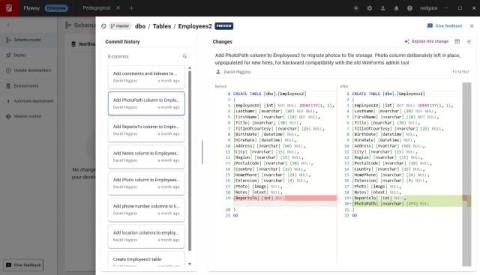
Every change has a story: introducing Object Level History in Flyway Desktop

You open a stored procedure to make what should be a quick fix, and something doesn't add up. There's a filter you don't recognize, or a column that has changed type, or a join that looks like it was added in a hurry. Who changed this? When? And, most importantly, why? We're excited to announce that object level history is now available for Redgate Flyway Enterprise users of Flyway Desktop.

The hidden cost of inconsistency in engineering teams | The Simple Talk Podcast

Engineering teams' time and money are often drained by mismatched tooling and poor habits, among other things. The Redgate Advocates share their own stories of this in reality - from a mysterious 47-second retry, to the one 'rogue' engineer who derails a team. They also discuss how to get everyone pulling in the same direction without forcing everything to be identical, and whether AI helps or hurts.

Analyze Data & Create Reports Across Databases with dbForge Edge

Analyze, visualize, and report database data across multiple database systems and cloud services with dbForge Edge. Write SQL queries or generate them with AI Assistant , analyze data with Pivot Tables, explore related records with Master-Detail Browser, visualize findings in charts, and create clear database reports — all within one multi-database solution.

VictoriaLogs Has Now a Long Term Support (LTS) Release

VictoriaLogs now runs in production everywhere, and many teams running it have told us the same thing: everyone wants new features, but it’s hard to keep upgrading their logging backend every few weeks. They want the mix of stability and up-to-date security that only LTS releases can satisfy. We’re happy to announce the first Long Term Support (LTS) release of VictoriaLogs: v1.52.1. This is the start of a new v1.52.x LTS line.

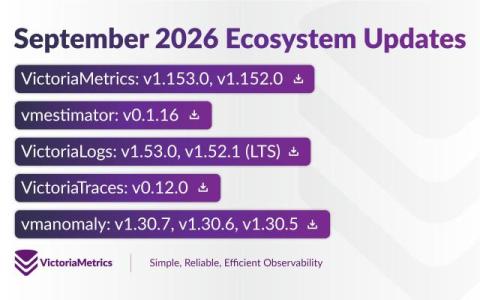
VictoriaMetrics September 2026 Ecosystem Updates

Another month whooshed by, bringing a slew of updates: 3 vmanomaly and 2 VictoriaMetrics releases, and new versions of vmestimator, VictoriaTraces, and our first ever LTS release of VictoriaLogs. This brings 12 months of stability to VictoriaLogs Enterprise users. But the big one was the launch of VictoriaTraces on VictoriaMetrics Cloud. Finally, we can offer a complete managed observability stack with metrics, logs, and traces. We run it, you use it. This ecosystem update includes.

Data Analysis & Reporting Across Databases and Cloud Services With dbForge Edge

Analyze data and create reports across multiple database systems and cloud services with dbForge Edge. dbForge Edge brings SQL querying, data analysis, visualization, reporting, and automation into one multi-database solution. Use the built-in SQL development tools and AI Assistant to retrieve data, analyze large datasets with pivot tables, inspect related records with Master-Detail Browser, visualize findings in charts, and create clear and compelling data reports.

SecureBridge 12.1, EntityDAC 4.1, and dbExpress drivers: Support for RAD Studio 13 Florence Release 2, SQL Server 2025, and MySQL 9.7

New versions of SecureBridge, EntityDAC, and dbExpress drivers are out. All three now work with RAD Studio 13 Florence Release 2 and offer improved support for the Arm64EC target platform. Devart dbExpress drivers also add support for Microsoft SQL Server 2025 and MySQL 9.7, while SecureBridge gains SFTP upload resume, multipart/form-data support, and a new SSL/TLS demo.

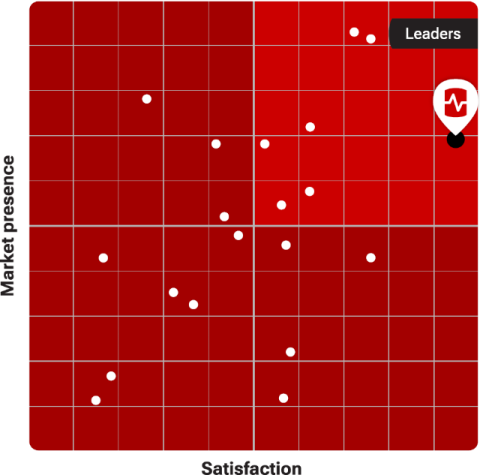
Redgate Monitor is a Leader in G2's Fall 2026 database monitoring report

G2's Fall 2026 Grid Report for Database Monitoring is out, and Redgate Monitor is named a Leader. G2 builds its reports from verified user reviews rather than paid placement, so this recognition comes from the people who use Redgate Monitor every day, and took time out of their lives to tell others what it's like. So, a big thank you to our customers, we're grateful for every review.

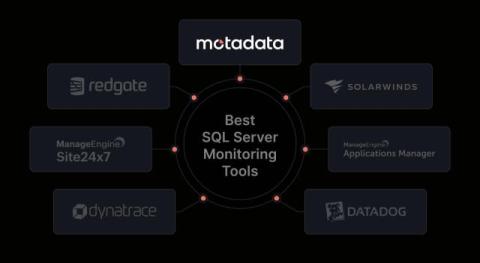
7 Best SQL Server Monitoring Tools for 2026

A slow query can affect an application before the database team knows what is causing it. A blocked session, failed job, or growing database file can create more problems if no one spots it early. That’s where SQL Server monitoring tools come in. They help you track database performance, find slow queries, monitor waits and locks, and see what changed before a problem occurred.

How to Monitor Database Backups and Get Alerted When One Fails

To monitor a database backup, make the backup script check its own output (exit code, file size, a table you know must be there) and ping a heartbeat URL only when all of it passed. If that ping does not arrive on schedule, you get an alert. A backup that failed, wrote an empty file, hung, or never started all look the same from the outside: no success ping.

pgvector for RAG: When you don't need a dedicated vector database

Dedicated vector databases have become such a standard part of the RAG conversation that teams often add one before they have proved they need it. According to studies, over 70% of companies using LLMs are using vector databases and RAG to customize their models. That shows how quickly the pattern has become normal. However, it does not mean every RAG application needs a separate retrieval system. If your application already runs on PostgreSQL, pgvector may be enough.

The Data Race That Wasn't a Bug (and the One That Was)

Imagine this: you are testing the performance of some part of your application. Everything is going smoothly, the numbers look good, and as a last check you turn on Go’s race detector. Then, out of nowhere, it prints a warning you didn’t expect: So you look at it. You look at it again, and again, and you think: “What the…?” The race is between your code and a goroutine you never started, somewhere deep inside net/http. You have no idea how that is possible, or why.

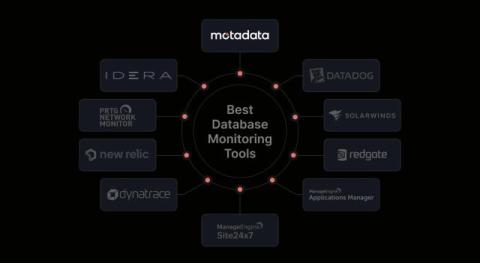
10 Best Database Monitoring Tools for 2026

If your company relies on multiple databases and applications, keeping track of database performance can become difficult. You may face challenges such as: As your database environment grows, identifying the cause of performance issues becomes harder without the right monitoring in place. I get why database monitoring tools have become an important part of managing database performance. They help you monitor database activity, spot performance issues, and find what is causing a slowdown.

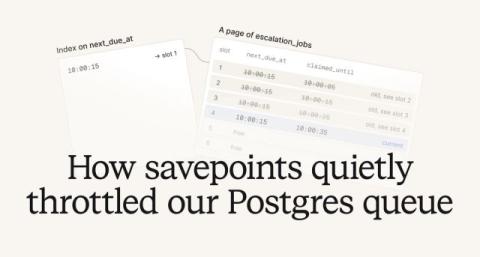
How savepoints quietly throttled our Postgres queue

At incident.io we are huge fans of Postgres; we've written about it a lot over the years, including how to choose the right indexes and how we're proud of being boring (The Pet Shop Boys). We use Postgres as our primary transactional database, which as of today has ~900 tables, and counting! The vast majority of our codebase does something along the following lines: read some data from Postgres, execute some business logic, then write that data back to Postgres. It is not, however, always that simple.

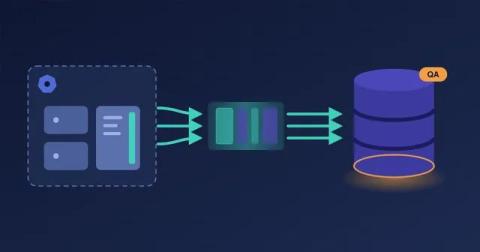
Load Test PostgreSQL Instantly using Production Recordings

The first PostgreSQL post ran on a laptop: a demo app, a Docker container, and the proxymock CLI. That is the fastest way to see the idea. It is also not where your database problems live. Your real query mix lives in the cluster, where a Java service with a connection pool, an ORM and a schema migration tool sends the statements nobody wrote by hand. This post deploys an open source banking app to Kubernetes and records the queries one of its services sends to PostgreSQL.

The Year-2 Price Cliff: What Your Observability Stack Really Costs Over 3 Years

I’m not the one whose phone lights up at 3 a.m. when production breaks. But I’ve spent years working alongside the engineers who are, and I’ve noticed that observability migrations happen for two reasons. Either engineering needed one, or, far more often, a quote landed that looked too good to refuse. The engineers rarely regret the first kind. The second kind they tell me about in year two, usually with a renewal notice in hand.

The hidden costs of AI (and who ends up paying them) | The Simple Talk Podcast

AI budgets are escalating rapidly, yet few teams measure the value of their spend – and who ends up paying, anyway? The Redgate Advocates discuss that, LLMs, data centers, regulation, what happens to the next generation of engineers if they never learn to solve problems the hard way – and more.