Kamon

Zagreb, Croatia
2013
  |  By Ivan Topolnjak
Your liveness and readiness HTTP endpoints can generate a bunch of useless Spans and can mess with your latency metrics. On this post we’ll learn how to configure Kamon Telemetry to completely ignore these enpoints for good.
  |  By Ivan Topolnjak
Today we are introducing Local Tail-Based sampling in Kamon Telemetry! We are going to tell you all about it in a little bit but before that, let’s take a couple minutes to explore what is sampling, how it is used nowadays, and what motivated us to including local tail sampling in Kamon Telemetry.
  |  By Ivan Topolnjak
After years of helping developers monitor and debug their production systems, we couldn’t help but notice a pattern across many of them: they roughly know that metrics and traces should help them get the answers they need, but they are unfamiliar with how metrics and traces work, and how they fit into the bigger observability world. This post is an introduction to how we see observability in practice, and a loose roadmap for exploring observability concepts in the posts to come.
  |  By Kamon
If you already had some experience with Kamon, you probably saw Kamon create Spans automatically for a lot of stuff, including HTTP server requests, database calls, actor messages, and more. But what happens when you want to create Spans for methods or code blocks that Kamon doesn’t instrument automatically? Let’s look at the two simplest ways to create Spans programmatically with Kamon.
  |  By Kamon
In this article we discuss the origin story of Kamon’s Range Samplers: what they are, how they work, and how we use them to monitor queues, connection pools and more.
  |  By the Kamon Team
Kamon APM wakes up today with a new home page for all your observability data: the all-new Kamon APM Service Map! The Service Map shows a real-time representation of all your microservices and the dependencies between them, combined with health status and easy access to the most important bits of data from your entire infrastructure.
  |  By Kamon
Dear community, Kamon 2.0 is out and ready to roll! For this release we focused primarily on simplifying the installation proces and making sure that the core APIs are more solid and user friendly, since they will be the foundations upon which we will instrument the whole JVM world in the months to come!
  |  By Kamon
We are pleased to announce the availability of Kamon APM, a hosted APM solution built from the ground up to work nicely with Kamon and along with it we are launching a Free Starter Plan. Starting today there are no excuses for your team to say that you can’t have metrics and distributed tracing in production becase, well, you can get it for free!
  |  By Kamon
Dear community, yesterday Diego and Ivan had a call to discuss a bit of what we think the future of Kamon should look like and we wanted to summarize the ideas and share with the community.
  |  By Kamon
Today we are announcing Kamon 1.1.0 with a couple bugfixes and a small but important improvement on context propagation, plus several minor updates on other modules that sort of went under the table for Akka, Akka Remote, Akka HTTP, Play Framework, Http4s and our sbt-aspectj-runner plugin.
  |  By SphereIT
Steffen Gebert of Emnify talks about monitoring Akka with Kamon 1.0.
  |  By Scala Central
Hugh Simpson talks about Kamon and Jaeger from context propagation to tracing.
  |  By DevOps Meetup Würzburg
Kamon's Ivan Topolnjak is talking about Distributed Tracing at the combined meetup of Akka Meetup Würzburg & DevOps Meetup Würzburg.
  |  By Scala Swarm Conference
This talk was recorded at Scala Swarm Conference 2017 in Porto, Portugal. Subscribe to our YouTube channel and follow us on Twitter https://twitter.com/ScalaSwarmConf and https://scala-swarm.org website for more information.
  |  By BeeScala
This talk was recorded at BeeScala 2016 in Ljubljana, Slovenia. Follow along on Twitter @BeeScalaConf and on the website for more information http://bee-scala.org.
  |  By Parleys
During this session we will review the motivations for some of the core design decisions in Kamon, how those decisions affect the quality and relevance of the information that Kamon can collect from your application and how that can help you make your application better (live demo included).

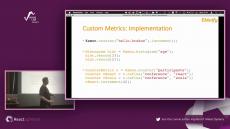
Kamon is a monitoring toolkit for applications running on the JVM. It gives you Metrics, Tracing and Context Propagation APIs without locking you to any specific vendor. All Kamon APIs are completely decoupled from the services that can receive the data, be it StatsD, Prometheus, Kamino, Datadog, Zipkin, Jaeger or any other supported reporter, with Kamon you instrument your application once and report anywhere you want.

From a bird’s eye view, Kamon can be decomposed in three main components: the core APIs for metrics, tracing and context propagation; the automatic instrumentation modules and the reporting modules. Your services’ code will only ever interact with Kamon’s APIs and abstract you away from how and where the collected data will end up going to.