Operations | Monitoring | ITSM | DevOps | Cloud

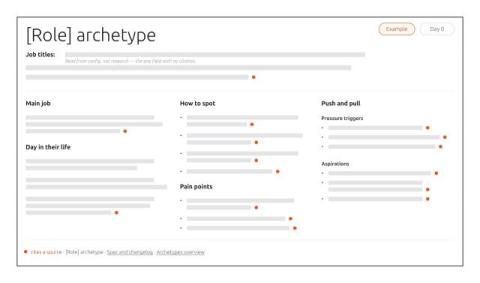
From personas to archetypes: a living, shared understanding of the people we build for (Part 1 of 2)

Personas are easy to create but often ignored. This is the first of two posts about how we developed archetypes to keep our personas fresh at Canonical. These are shared, machine-readable descriptions of our users that multiple teams and their agents can use. This post explains the system, its purpose, and its structure. The second post’ll cover how we maintain and update it. Personas should be functional tools.
Unable to get local issuer certificate, explained

Your site loads in Chrome fine. Then a deploy script, a webhook, or integration calls the same URL and gets this: Python says certificate verify failed: unable to get local issuer certificate. Node says unable to get local issuer certificate, or unable to verify the first certificate. It’s all the same problem. It’s a misconfiguration between your certificate and a trusted root. Either the server isn’t sending it, or the client doesn’t have it.

6 improvements that make Grafana Assistant better at helping your workflows

When you ask Grafana Assistant to build a dashboard or investigate an alert, you're doing so because there's work to be done. To do that work effectively, you need the right data, changes you can inspect, and conclusions supported by evidence. You also want Assistant to avoid mistakes and act quickly. Over the past six months, our team has worked hard to improve what makes those outcomes possible.

A secure Shopify checkout doesn't mean your entire store is secure

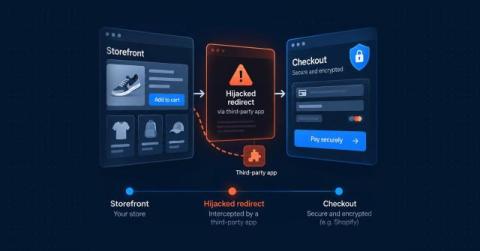
Recent Shopify checkout hijacking attacks reveal an important security risk that many online retailers may not realise exists: the difference between Shopify itself, the apps installed on a store, and the software customers interact with before reaching checkout. In this article In October 2026, customers visiting legitimate Shopify stores were redirected to fraudulent checkout pages designed to steal their payment details. The stores were real. The products were real.

How SGP.32 unlocks next-generation IoT deployments

Every time a smart utility meter transmits consumption data, a connected vehicle updates its telemetry, or a fleet of logistics trackers crosses international borders, seamless and uninterrupted connectivity is vital. Yet for years, managing Internet of Things (IoT) devices at scale has been constrained by physical SIM logistics, operator lock-in and remote SIM provisioning standards that were simply never built for autonomous, resource-constrained hardware.

AI wrote the bug. You need production data to reproduce it

A pull request lands with a function an AI assistant generated. It reads cleanly, passes the existing tests, and gets merged. Three weeks later it breaks, but only for accounts with a specific billing history. Nobody wrote a test for that condition because nobody was thinking about it when the code went in. Now someone has to debug logic they didn't reason through, against a failure they can't picture without the exact data that triggered it. Debugging someone else's code has always worked this way.

Autonomous IT: Data, Context, and Governed Action | 2H Announcement from LogicMonitor

Autonomous IT requires three things: complete, AI-ready data; connected context; and governed action. In LogicMonitor's 2H announcement, we show enterprise IT and ITOps leaders how each layer works. LogicMonitor is the AI-first platform for Autonomous IT. This update covers the three layers behind autonomous IT operations as the category moves from systems of intelligence to systems of action. Your team decides when Edwin AI moves from recommending an action to taking it.

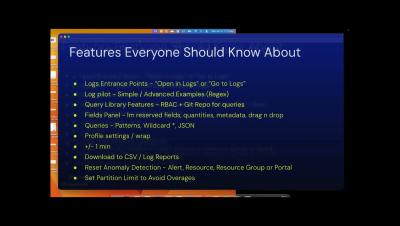
LM Logs Tips: Alert-to-Logs Workflow for Ops Team | Logs for Lunch

LM Logs troubleshooting starts at the alert. This Logs for Lunch session shows ITOps teams an alert-to-logs workflow and lesser-known LM Logs tips. Ryan Matuszewski demos a Tomcat application error. From the alert's Logs tab, he moves through log anomaly detection, All Logs, Log Patterns, and Log Analysis sorted by sentiment. He then opens the Logs page with the alert time range, and the same steps work for any alert type.

Cloud Log Monitoring & Root Cause Analysis | Logs for Lunch

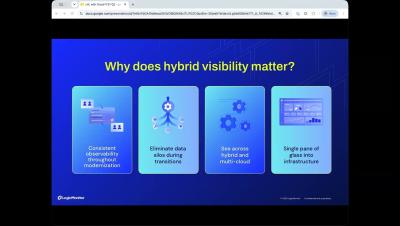
Cloud log monitoring in LogicMonitor connects a service alert to the log event behind it. This Logs for Lunch July demo is for ITOps, CloudOps, and SRE teams. Tom Chavez hosts Ismath Mohideen (Product Marketing) and Nick Doane (Senior Sales Engineer). They cover cloud observability and multi-cloud monitoring across AWS, Azure, GCP, and OCI in LM Envision, using cloud provider APIs with no extra collectors.