Operations | Monitoring | ITSM | DevOps | Cloud

The Place Where Modern Operations & Technology Come Together


Your Observability Stack Found the Fire. Congratulations.
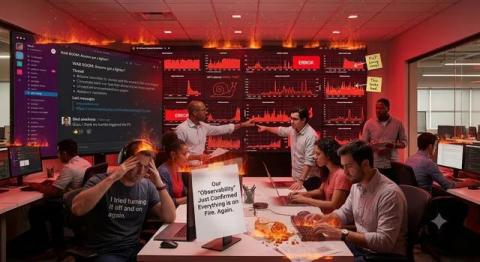
The dashboards are red, the alerts are firing, and Slack has officially become a war room. Someone has asked, “Anyone else seeing this?” and 14 people have immediately responded with screenshots. Welcome to another day in distributed systems. The recent GitHub outage is a great reminder of how complicated modern applications have become. Services talk to services, infrastructure scales up and down, retries multiply traffic, and dependencies behave in ways nobody expected.

The Compounding Platform Tax
Private cloud and on-premises infrastructure are different. I know this. I used the terms interchangeably anyway because I was trying to compress a pattern into one sentence. That was sloppy, but the underlying pattern still matters. Banks run Kubernetes differently from most other organizations. Not because every bank makes the same choices, but because similar constraints can produce a similar pattern.

Shipped: API keys that keep their own permissions current
The most common reason to create an API key in CloudZero is to send data, such as AI telemetry or billing exports. Until now, that meant picking individual scopes from a list and hoping you chose the right ones. That works on day one. The problem is day ninety. Permissions on a key have always been a snapshot of the day you created it. A new AI telemetry endpoint ships in October, and a key created in August has no idea it exists.

Application Level Dependency Chaos Testing
Somewhere in your service is a branch that has never executed. Not a rare one, a never one. It handles a dependency being unavailable: it reads from a cache, it returns a stale value, it marks the response degraded so callers know not to trust it too far. It was written carefully. It was reviewed. Whether it works is an open question, because nothing in the test suite makes that dependency fail, and the dependency does not fail on request.

Break One Dependency, Not The Whole Cluster
Scoped chaos rules are now in proxymock. A filter query picks the traffic, an effect perturbs it, and every response that gets touched is labelled so you can tell an injected failure from a real one for the rest of the run. Available in v2.5.892 and newer. The short version of why: kill a pod and you learn something real, but you do not learn what your service does when a dependency stays up and starts lying to it.

I built an API traffic classifier for business workflows
An engineering leader asked me a question a few weeks ago: could we read their business workflows out of API traffic instead of asking people to document them? I said it should be possible. Then I tried it. A few engineers know how the system really works. They know which calls make up a work order and which checks happen after a write. That stuff rarely makes it into the test plan. Usually it’s in somebody’s head. Sometimes it’s in several heads, with slightly different answers.


Monitor dependencies now available in the v3 API
Monitor dependencies are now available through the StatusGator v3 API. The new endpoint lets you programmatically retrieve the relationships and dependencies associated with a monitor, giving your integrations and internal tools more context about the services each monitor relies on. Dependencies are already available in the StatusGator UI for Website, Ping, and Custom monitors, while StatusGator automatically identifies relationships for many Service monitors.

MCP vs API: How they work together and when to use each
Summary: An API defines how software interacts with a service. MCP defines a standard way for AI applications to discover and invoke tools exposed by a service. They usually work together: an MCP server can sit in front of APIs you already run, turning low-level operations into capabilities an agent can find and use at runtime. Your API may already expose everything an AI agent needs. The harder problem is helping the agent figure out which operations matter for the task it has been given.

Let AI Agents Own Your Monitoring: From Setup to Auto-Fixed Incidents
Your AI agent can set up your monitoring, report on platform health, and open a PR to fix a failing check. All this works automatically. In this webinar, Stefan (Developer Relations at Checkly, Google Developer Expert & Playwright Ambassador) demonstrates how Monitoring as Code makes Checkly agent-friendly by design, and walks through three agentic workflows live.

From Telemetry to Traffic
A metric says latency increased. A log says a request failed. A trace identifies the slow dependency. An APM agent points to the method. Manual instrumentation explains the business operation. Traffic capture shows the exact request and response that triggered it. Each layer answers a question the previous layer could not. Each also introduces a new cost, blind spot, and failure mode.

Reliability Engineering in the AI Era
Engineering leaders have been claiming to “shift quality left” for years but production remains stubbornly stuck out of reach of software engineers. The realm of production remains mysterious with tools no one has access to and UIs that wouldn’t make sense to engineers anyway. I’ve noticed a small but growing trend of large enterprises hiring Reliability Engineers instead of Site Reliability Engineers. Dropping one word looks cosmetic but I think it points to a much bigger change.
Meet the official UptimeRobot CLI.
Managing monitors has meant one of two things: the dashboard, or writing your own API calls. There is now a third. The official UptimeRobot CLI is live on npm, and it drives every monitor, incident, and status page in your account from the shell you already have open. It is free, open source under Apache 2.0, and works on every plan including the free one.


SSIS Data Flow Components Update Brings Expanded API and Data Source Support
The latest release of Devart SSIS Data Flow Components expands support for cloud applications and databases with new objects and fields, updated API and metadata support, and improved authentication and data access capabilities across multiple connectors.

What Banking API Documentation Tells You About a Vendor, and How viaBanking Writes It
Every banking API demo looks the same. Clean dashboard, confident numbers, a sandbox that works on the first call. The differences surface three weeks into the integration, when your engineers hit an edge case the demo never covered. There is a faster way to see those differences. Read the API documentation before you read the sales deck.

Chaos Monkey Won't Find Your Bug
We shipped a chaos feature that never caused any chaos. Our mock server has had a fault-injection effect for years with a straightforward job: withhold the response entirely and see whether the caller copes. Last week I audited it against the actual code path. It had never withheld anything. The handler returned early without writing a response. Go’s net/http then did what it is designed to do, which is synthesize a 200 OK and flush the recorded body.

Loop engineering can fix your slow API
#loopengineering #claudecode #programming #observability

Separate Application Latency From Network Failure With Hubble
The request timed out after five seconds. The application said context deadline exceeded. The dependency was healthy, its dashboards were green, and its own latency histogram showed nothing above 30 milliseconds.


Building an End-to-End Drone Ecosystem: The Technologies That Need to Work Together
Commercial drone technology is rarely a single application running alongside an aircraft. A complete solution may include flight software, onboard sensors, telemetry, cloud infrastructure, web and mobile interfaces, data processing pipelines, analytics tools, and integrations with existing business systems.

Observe Opaque Services With OpenTelemetry eBPF + proxymock
Every SRE team operates services it cannot see into: a vendor binary, an inherited legacy deployment, a container whose owning team dissolved two reorgs ago. The routes are undocumented, the dependencies are unknown, and when a request takes 130 milliseconds nobody can say whether that time is application work or a wait across a network boundary.

Best news APIs in 2026: 6 platforms compared for coverage, enrichment, and cost
Content teams and AI builders no longer treat "news API" as one category. Some products need a raw headline feed for a dashboard; others need clustered, entity-tagged articles that slot straight into a retrieval pipeline without building a separate NLP layer on top. This list compares six providers worth testing in 2026: Newscatcher API, NewsAPI.org, GNews, Mediastack, NewsData.io, and Webz.io, judged on source coverage, enrichment, real production pricing, and how far the free tier actually goes.
Sponsored Post

Flamegraphs Find It. Replay Proves It.
I made an API endpoint 13 times faster. Then I realized my first verification only checked the status, headers, and response schema. I had not checked the totals. I had made the bug faster. That is the problem with giving an AI coding agent one kind of evidence. A CPU profile can show where the application is slow, but not whether an optimization preserves behavior. A traffic replay can prove that behavior stayed stable, but not explain why the code burns CPU. This walkthrough gives the agent two independent witnesses: Together, they turn AI code verification into an experiment with two independent checks.

The Pod Was Cheaper. The Service Wasn't.
A smaller Kubernetes pod can lower allocation cost while completing less work. Green status codes and matching schemas can hide it. This walkthrough combines OpenCost allocation data with proxymock behavior and performance evidence. A candidate passes only when behavior and throughput hold while unit cost falls.

Diagnose Serial N+1 API Calls With Tempo + proxymock
One API request took 302 milliseconds. Nothing failed. CPU was mostly idle. The response was correct. The trace made the problem obvious: eight inventory calls, each waiting for the previous one. But the trace could not tell me why the application made eight calls, or whether changing their execution would preserve the response. It showed the shape of the wait, not the input that created it.


Pyroscope + Proxymock to Solve Performance Problems
This video provides a step-by-step demonstration of how to record an application's real-world traffic and generate an automated sandbox environment for debugging and testing.


Cut AI coding defects by 33% #mcpserver #aicoding #aiagents #grafana #aitools
We spend thousands of dollars "token maxing" and running endless debugging cycles just to walk our LLMs through a problem. But is the AI actually failing, or are we just withholding the right environment? Giving your AI assistant its own sandbox to test hypotheses might just be the missing link in your development workflow.