Sysdig Boosts AWS Security with the First Automated Inline Scanning for Fargate
Sysdig also adds threat detection using AWS CloudTrail with open source Falco.


Another PagerDuty Summit is in the books, and we’re still coming down from the excitement and energy our customers and community showed us over the past week. We made several big announcements over the course of the conference, but none more significant than the AIOps advancements on our digital operations platform. We introduced a number of ways customers can apply machine learning algorithms and automation to a wide range of workflows across the platform.
In just 24 hours, tech bloggers and news sites everywhere have been sharing Ivanti's latest acquisition announcement. The news has been picked up by several publications including Redmond Magazine, MarketWatch, TechTarget, WSJ Pro Cybersecurity, and Channel Futures. And while we're delighted to be picked up by so many publications (seriously, we feel like the popular kid at school!), we're glad you've found yourself here on the Ivanti blog!
Interlink is delighted to announce that it has arrived on the Gartner Peer Insights platform. Interlink’s customers can now leave honest reviews of their experiences of how our Hybrid IT Infrastructure Monitoring solution is meeting the challenges of managing service availability in their enterprises.
Today we are officially releasing Graylog v3.3.6. This release includes a new enterprise output along with bug fixes that improve the functionality of Graylog. Please read on for a detailed description of the new output and the bug fixes. Many thanks to our community for reporting issues and contributing fixes!
LogicMonitor is pleased to announce enhancements to our Slack integration. The new integration is now bidirectional, allowing users to acknowledge and SDT alerts from their Slack workspace. LogicMonitor accounts come pre-configured to integrate with Slack. The integration enables LogicMonitor to create Slack Channel Notifications based on LogicMonitor alerts.
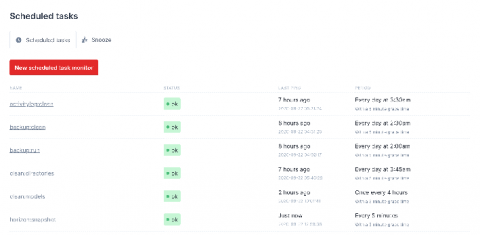
After an intense testing period, we're excited to announce our scheduled task monitoring is now available to all our users!