Operations | Monitoring | ITSM | DevOps | Cloud

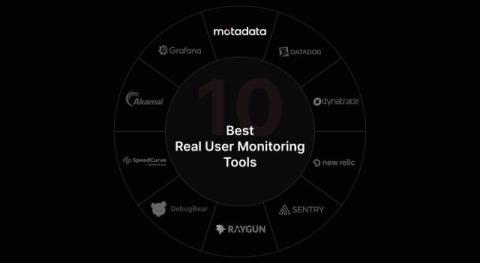
10 Best Real User Monitoring Tools Compared for 2026

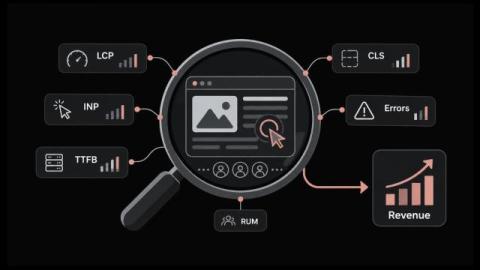
Most IT teams learn their application feels slow when a customer complains. Server metrics never measure what a person on a phone waits for. The best real user monitoring tools close that gap by collecting timings from your users' browsers. Choosing one got harder this year, because the measurement standard moved. In this blog, we compare the best tools for real user monitoring, including their pros, cons, and key features. By the end you will know which one fits your stack.

Real User Monitoring: Introducing Session Replay for eG Enterprise

In the hospitality industry, every second counts—especially when it comes to online bookings. Recently, I’ve been working with a hospitality customer who relies on eG Innovations SaaS to monitor the performance of their booking website. Like many modern sites, theirs is powered by numerous plugins and external third‑party services, each playing a crucial role in delivering a smooth booking experience while also introducing potential points of delay.

Monitor your .NET MAUI apps with Datadog RUM

As.NET Multi-platform App UI (MAUI) becomes the default cross-platform UI framework in the Microsoft ecosystem, many teams are standardizing on it to build mobile applications for iOS and Android. However, observability has not kept pace with the shift in adoption. Developers often rely on unsupported community bindings or maintain their own wrappers around native iOS and Android SDKs, which introduces instability and ongoing maintenance.

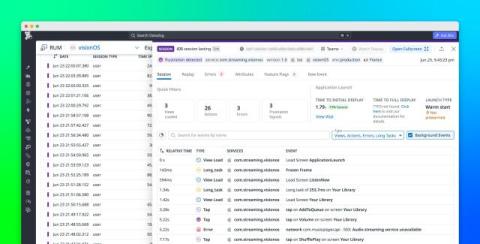
Monitor watchOS and visionOS apps with Datadog RUM

Apple’s platform ecosystem is evolving as developers build production applications for watchOS and visionOS. Whether it’s a fitness app on Apple Watch or an immersive spatial computing experience on Apple Vision Pro, these platforms have moved beyond the experimental phase to support real users. Despite this growth in adoption, teams lack visibility into how their apps behave on these devices.

Monitor JavaScript framework routing with Datadog RUM

Modern web applications rely on frameworks like Next.js, Vue, and Angular to handle routing and rendering. In these architectures, navigation happens within the application rather than through full page loads, which makes it difficult for traditional browser instrumentation to capture what users actually experience. As a result, teams often see misleading view names, missing navigations, and errors that are either misattributed or not captured at all, especially during hydration or lazy loading.

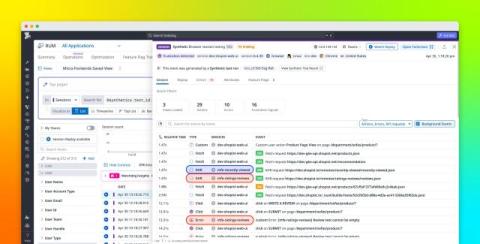
Simplify micro-frontend observability with Datadog RUM

Micro-frontend architectures, where independent teams build and deploy separate parts of a frontend application, introduce an observability challenge: Telemetry data is fragmented across services, making it difficult to determine which micro-frontend caused a performance degradation or error spike.

Measure and improve mobile app startup performance with Datadog RUM

Mobile app users form opinions quickly. A slow or inconsistent startup experience can frustrate them before they reach the first screen, increasing the likelihood that they abandon the app or fail to complete key actions such as signing up or making a purchase. However, app teams often lack reliable signals that explain why startup performance varies, making it difficult to improve the user experience.

Uptime.com Real User Monitoring Report

Take an in-depth tour of the Uptime.com RUM report. Comprehensively understand your users – and your baselines. Organize RUM data by URL(s) or group URL(s) to track subdomains; segment data by devices, operating systems, browsers, countries, other geographies – to compare metrics within specific time windows to your website or application’s performance monitoring baselines.