We are offering a variety of on-demand Elastic training courses for free — featuring 11 titles that span observability, security, and Elastic Stack administration. If you haven’t tried one of our self-paced courses yet, now is the perfect time to find out why so many people have shifted their learning preference from in-class to online. Our on-demand courses provide the same immersive learning experience found in the classroom, but delivered in a convenient, remote environment.
Elasticsearch allows you to store, search, and analyze large amounts of structured and unstructured data. This speed, scale, and flexibility makes the Elastic Stack a powerful solution for a wide variety of use cases, like system observability, security (threat hunting and prevention), enterprise search, and more. Because of this flexibility, effectively architecting your deployment’s data storage for scale is incredibly important.
Apache Arrow, a specification for an in memory columnar data format, and associated projects: Parquet for compressed on disk data, Flight for highly efficient RPC, and other projects for in-memory query processing will likely shape the future of OLAP and data warehousing systems. This will mostly be driven by the promise of interoperability between projects, paired with massive performance gains for pushing and pulling data in and out of big data systems.
In this article, we’ll learn about the Elasticsearch flattened datatype which was introduced in order to better handle documents that contain a large or unknown number of fields. The lesson examples were formed within the context of a centralized logging solution, but the same principles generally apply. By default, Elasticsearch maps fields contained in documents automatically as they’re ingested.
One of the most common dashboards for metric visualization and alerting is, of course, Grafana. In addition to logs, we use metrics to ensure the stability and operational observability of our product. This document will describe some basic Grafana operations you can perform with the Coralogix-Grafana integration. We will use a generic Coralogix Grafana dashboard that has statistics and information based on logs. It was built to be portable across accounts.
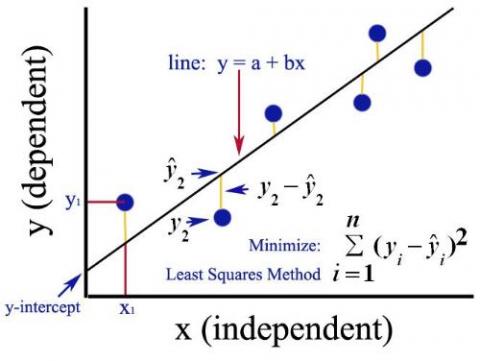
The world is full of linear relationships. When one apple costs $1 and two apples cost $2, it's easy to figure out the price of any number of apples. But what happens when you have 100s of data points? What if your data source is noisy? That's when it's helpful to use a technique called linear regression. In this article Julie Kent shows us how linear regression works, and walks through a practical example in Ruby.