Operations | Monitoring | ITSM | DevOps | Cloud

The Place Where Modern Operations & Technology Come Together

The latest News and Information on DevOps, CI/CD, Automation and related technologies.

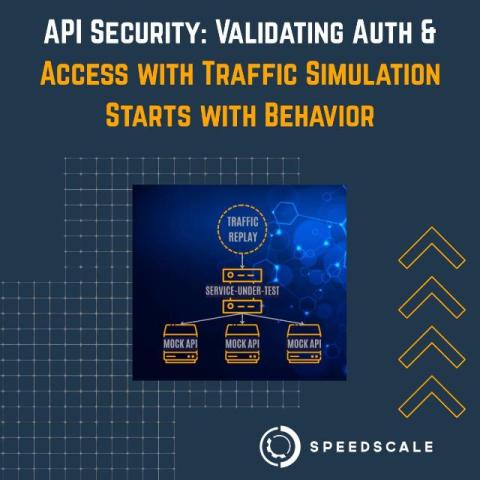
API Security: Validating Auth and Access with Traffic Simulation Starts with Behavior
Security breaches rarely begin with a hidden zero-day exploit or a complex web of escalated hacks. They often start in very simple ways – an internal team member is breached, a permission is misconfigured, an overly permissive API endpoint is overlooked, or a JWT simply doesn’t expire. An API, or application programming interface, is a set of protocols and tools that enable different software systems to communicate and exchange data, making them essential in modern software development.

Fix Vulnerabilities Faster: Puppet's Advanced Patching Solution
Break down patching silos and remediate vulnerabilities faster with Puppet. Most CVEs sit unaddressed for weeks, even after your scanner picks them up. Vulnerability Remediation in Advanced Patching (a Puppet Enterprise Advanced exclusive) gives Security and Ops teams an easy-to-use dashboard for finding, fixing, and reporting on vulnerabilities. No more tossing CVEs over the fence. No more finger-pointing when things go wrong. Just swift, efficient vulnerability management.

Looking beyond dev productivity to increase speed ft. Brian Guthrie of Justworks
Speed isn't just about developer productivity—it's about market dominance. Rob sits down with Brian Guthrie, Director of Engineering at Justworks and former ThoughtWorks consultant, to explore why lead time from conception to production should be your organization's north star metric.
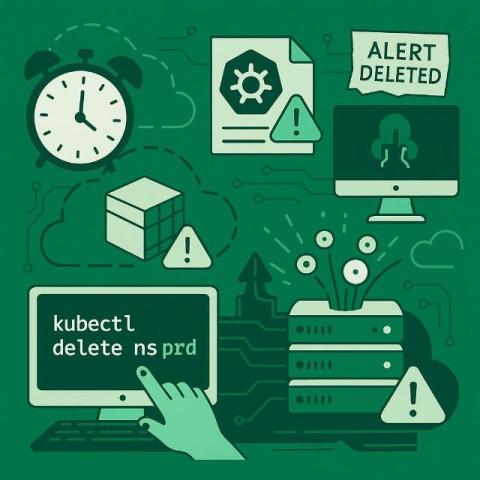
Kubernetes Clusters Break in the Weirdest Ways
If you’ve ever spent hours chasing a weird issue in your Kubernetes cluster, you’re in good company. Reddit’s r/kubernetes is full of hilarious and painful stories about clusters going off the rails for reasons no monitoring dashboard ever predicted. And while it’s easy to laugh after the fact, each of these moments highlights just how important observability is because these kinds of problems don’t show up on your radar until it’s too late.

How to ensure your AWS workloads are resilient
Part of the Gremlin Office Hours series: A monthly deep dive with Gremlin experts. Cloud providers like AWS give you plenty of tools to make your workloads more resilient, but it’s up to you to apply them. However, considering how complex some of these tools are, where do you start? And how can you be sure your systems are more reliable as a result?

Let Git Find the Bug for You (No Guessing)
Somewhere in your commit history, a bug snuck in. You could scroll. Panic. Guess. Or — you could let Git find the exact commit that broke your code. In this episode of Wait… Git Can Do That?, we show you how git bisect binary-searches your history to isolate the problem — fast, clean, and testable. Use git bisect start, good, and bad Test each step to narrow it down Or automate it with git bisect run.

Release v2.6: MCP Server, AI Insights Enhancement, Okta SCIM Integration, SNMP Monitoring and more.
Netdata 2.6.0 is here and it’s our most intelligent release yet! This version brings AI-powered monitoring, easier network visibility, and smoother enterprise integrations, all designed to help you troubleshoot faster and scale smarter. What's New: Netdata Referral Program Every referred user will get a 10% discount when they subscribe to Netdata Business or Homelab - and you will receive 10% of their subscription value (up to a max of 1000$ per space). You can refer an unlimited number of users, so there's no real limit to how much you can earn with the referral program.

Being on-call at incident.io
At incident.io, we are building a product that our users rely on 24/7, all year round. This means it is crucial that it is always working, and that is where our on-call rotation comes in. We believe that everyone should be on-call because it tightens the feedback loop between shipping new features and maintaining what we have, leading to more pragmatic engineering decisions.

Stream AWS Metrics to Grafana with Last9 in 10 minutes
It’s 2:47 AM and your Lambda functions are timing out. API response times are spiking. You’re flipping between the CloudWatch console, your APM tool, and your logs, trying to figure out what’s going wrong. CloudWatch has the metrics you need: CPU usage, memory pressure, and request rates — but connecting that data to what your app is doing takes time. The delay in stitching it all together slows down your incident response.