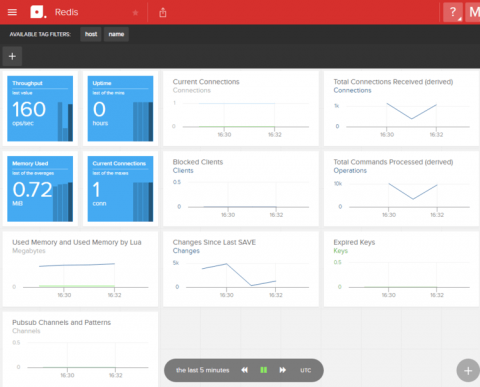
This article describes how to monitor a (cluster of) redis server. Bleemeo will detects automatically the redis server (it can runs in a Docker container or directly on the host) and create automatically a service dashboard. This article will also covers creating a custom dashboard with additional metrics.
Optimizing server performance is important in supporting end-user requirements. Using server optimization, actively monitor: Web server monitoring and optimization helps you to troubleshoot bottlenecks as they emerge and optimize server performance. In this post, we will discuss how to optimize performance and why it is important.

Logz.io is focused on creating the best observability service to manage the scale of monitoring, add value on top of AI/ML technologies, and enhance enterprise security. Metrics is one of the pillars of Logz.io, and our Prometheus-as-a-Service offering. It has been a crucial part of our platform goals, but if we turn the clocks back a year, our service only used the open-source Elasticsearch database (ES).
Data is everywhere in the form of values, text, numbers, pictures and so on that can be stored and used anytime when required. The importance of data and data storage systems has gained recognition since businesses find the potential of big data and its use cases. The data was with us always, but the possibilities to use it effectively were an arduous task.
In today’s post, we’ll dive into how we, at AppSignal, solved a daunting engineering challenge. Giving you a look into the kitchen, this post will show you how we tested a new database in production without having to worry about errors/downtime. Alright, let’s get cooking!
When DevOps teams talk about monitoring a database, the primary motivation is to ensure that the database won’t suffer a performance hiccup. Long queries, timeouts and table scans are among the most popular causes behind lousy customer experience. However, in recent years, more data has been shifted to cloud databases.
VoltDB is an ACID-compliant, in-memory relational database designed to support real-time analytics. VoltDB’s in-memory storage, stored procedures, and shared-nothing architecture make it specifically optimized for quickly processing massive streams of data. This means VoltDB is tailored for use cases like online gaming, telecommunication, and financial applications, which require fast data processing.
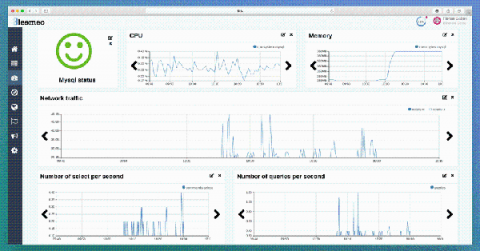
This article explains how to monitor service process on your service with Bleemeo using MySQL as an example. This feature is what we called "Key Process Monitoring" and is described by our documentation. Currently, you can monitor any service process automatically discovered by Bleemeo. All metrics are detailed in our documentation, in a few words, metrics related to memory, cpu, network and i/o used by this process are gathered by the agent.
Regardless of the tech stack used, many developers have already used Redis or, at least, heard of it. Redis is specifically known for providing distributed caching mechanisms for cluster-based applications. While this is true, it’s not its only purpose. Redis is a powerful and versatile in-memory database. Powerful because it is incredibly super fast. Versatile because it can handle caching, database-like features, session management, real-time analytics, event streaming, etc.
SQL is great, but sometimes you may need something else. By and large, the prevalent type of data that data engineers deal with on a regular basis is relational. Tables in a data warehouse, transactional data in Online Transactional Processing (OLTP) databases — they can all be queried and accessed using SQL. But does it mean that NoSQL is irrelevant for data engineering?