Operations | Monitoring | ITSM | DevOps | Cloud

Expand what's possible with Grafana: The Grafana Marketplace is now generally available

Earlier this year, we launched the Grafana Marketplace, a platform that gives independent software vendors, systems integrators, and developers in the Grafana community a new way to sell and distribute plugins built for Grafana. The Marketplace builds on our existing plugin catalog by enabling third-party partners and developers to earn revenue from their plugins and invest further in their development.
Full-stack observability in Grafana Cloud: More connections, richer context, and faster investigations for users and agents

Most teams have telemetry from across their stack, but connecting those signals to understand what's happening and how it affects users isn't always easy. Critical context about service dependencies, ownership, and past incidents often lives across tools, runbooks, and conversations between team members. That’s why, today at ObservabilityCON 2026, we’re announcing new capabilities that advance full-stack observability across Grafana Cloud.

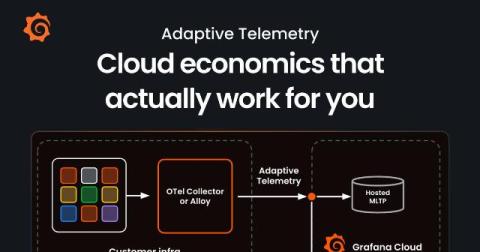
Break the link between data volume and your observability bill with Adaptive Telemetry

In the AI era, where telemetry is generated by every model call, tool invocation, and agent step, organizations need more help than ever when it comes to navigating the economics of observability. For a lot of teams, the default response is a "data diet" of shorter retention, which leaves services or environments out of collection, or basic sampling, which is more guesswork than strategy. Either way, you end up cutting to control the bill, and you risk losing the very data you need during an incident.

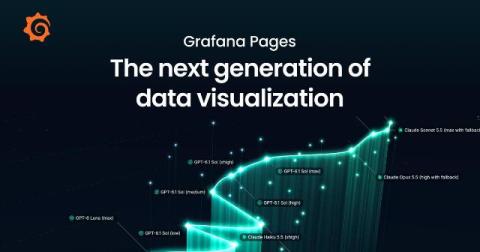
Grafana Pages: Turn data into interactive experiences with the next evolution of Grafana

Teams often spend as much time preparing information as discussing it: gathering charts, checking business reports, and finding the GitHub activity that explains a change. Every follow-up question can lead to yet another round of work. That's why, as part of ObservabilityCON 2026, we're excited to introduce Grafana Pages, a new feature in Grafana Cloud that gives you a canvas to describe what you need and build a live app in minutes, based on your real data, context, and interactions.

6 improvements that make Grafana Assistant better at helping your workflows

When you ask Grafana Assistant to build a dashboard or investigate an alert, you're doing so because there's work to be done. To do that work effectively, you need the right data, changes you can inspect, and conclusions supported by evidence. You also want Assistant to avoid mistakes and act quickly. Over the past six months, our team has worked hard to improve what makes those outcomes possible.

Coverage-first or cost-first: two ways to automatically apply Adaptive Metrics' recommendations

Adaptive Metrics , which is part of the Adaptive Telemetry suite, looks at how your metrics are actually used and recommends how much detail you should keep for each metric. This helps you cut costs while still retaining the data you actually need. Last year we added auto-apply capabilities that let you implement those recommendations automatically, but only with coverage-first behavior, maximizing coverage of whatever you're querying.

Get observability in your pocket with the Grafana mobile app

When you’re on the go, your phone is often the only observability tool you have. And what you can do with it in the first few minutes matters. With the incredible innovation that has gone into mobile CPUs, GPUs and displays, a phone is a powerful device where you can immediately see what’s happening and start acting on it. And the Grafana mobile app now allows you to both see and act.

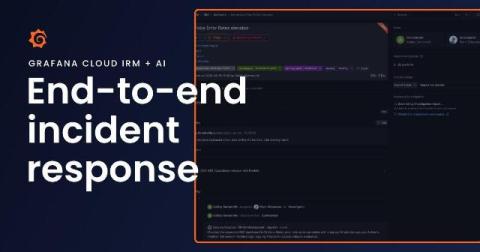
Go from alert to post-incident review with Grafana Cloud IRM and AI

You’ve got 10 minutes before your next meeting when your phone starts ringing. You’re being paged because the frontend is erroring with failed API requests. You open one tool to see what fired, then another to figure out what’s going on. You message a teammate in Slack to see if they’re noticing the same thing. That’s a lot of context switching, and it’s still how a lot of teams' incident response works today. Opening another tool and catching someone up takes time.

Manage your OpenTelemetry Collectors with Fleet Management in Grafana Cloud

If you’ve built your telemetry pipelines around OpenTelemetry Collectors, you’ve already invested in a collector distribution, YAML configuration, and a deployment model that fits your infrastructure. As that deployment grows, managing it means keeping shared configuration consistent, accommodating different workloads, and understanding whether your collectors are healthy. Fleet Management in Grafana Cloud brings those tasks together in one place.

Manage synthetic checks at scale: Introducing folders in Grafana Cloud Synthetic Monitoring

As your use of Grafana Cloud Synthetic Monitoring grows, so does the number of checks you need to manage across services, environments, and teams. Eventually, a single flat list of checks becomes difficult to navigate, and even simple questions get harder to answer: Which checks belong to the payments team? Can I disable everything in staging during a maintenance window? Who should be able to edit the checks for this service?