
Operations | Monitoring | ITSM | DevOps | Cloud

The latest News and Information on DevOps, CI/CD, Automation and related technologies.

Top SaaS Companies Defining The Future Of SaaS

Picture this. Gartner forecasts worldwide end-user spending for public cloud usage to total more than $720 billion in 2025 — up from $595 billion in 2024. Out of that spend, SaaS will make up a chunky $299 billion. For comparison, Infrastructure-as-a-Service (IaaS) and Platform-as-a-Service (PaaS) will make up nearly $212 billion and $209 billion, respectively. Elsewhere, BetterCloud’s State of SaaS 2025 report found that the average organization uses 106 different SaaS tools.

FinOps Is The Margin Lever SaaS CEOs Keep Ignoring

You’re probably not combing through cloud bills. That’s not your job as CEO. But if no one on your executive team can tell you what it costs to serve a customer, ship a feature, or launch a new product line, that’s a problem. Not a someday problem. A right-now, quietly-draining-your-margins kind of problem. FinOps tends to get lumped in with cost-cutting — some finance thing, some DevOps thing. But that framing misses the point. Done right, FinOps is a growth enabler.

Navigating the Complexities of Data Sovereignty: A Guide for UK Businesses

To read the full findings from this research, visit The Digital Sovereignty Revolution whitepaper by clicking here. As the digital landscape continues to evolve, one question is becoming increasingly pressing: are you in control of your digital future? With growing concerns around data sovereignty and the impact of geopolitical risks on cloud strategies, it's time to assess your organization's digital infrastructure.

What Makes Dev Tools Spark Joy for Developers?

Jovana Dunisijevic shares insights on how the right choice of Dev Tools can spark joy and boost developer velocity. She highlights the impact of company culture and innovation on team happiness. This talk emphasizes the importance of software engineering practices for a positive developer experience. GitKraken Desktop: gitkraken.com/git-client GitKraken CLI: gitkraken.com/cli GitLens for VS Code: gitkraken.com/gitlens.

TOP Salesforce Integration Tools

Looking to streamline your business workflows and boost Salesforce capabilities? In this video, we explore the top Salesforce integration tools that help connect Salesforce with the most popular apps like DBeaver, Power BI, Excel etc. Whether you're a developer, admin, or business leader, these tools can help you automate tasks, improve data flow, and enhance productivity.

Introducing Packet Filtering on Megaport Cloud Router

Megaport Cloud Router's new feature is here to cut complexity and secure your network even faster. If you’re already a Megaport customer, Megaport Cloud Router (MCR) likely needs no introduction. This popular and long-standing solution allows customers to spin up routing capabilities on-demand within Megaport’s global Network as a Service (NaaS) platform and can be utilized across a variety of use cases.

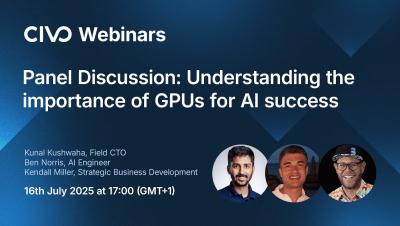
Boost Your AI Projects with GPUs: Live Expert Insights Webinar

Are you ready to supercharge your AI initiatives? Join our live webinar on July 16, 2025, at 05:00 PM, where Kunal Kushwaha, Ben Norris, and Kendall Miller will dive into the world of GPUs and their critical role in AI. Get ready to explore the latest insights and trends in GPU technology, including: This webinar is perfect for AI enthusiasts, startup founders, and engineers looking to stay ahead of the curve.

Prometheus Group By Label: Advanced Aggregation Techniques for Monitoring

Your Prometheus dashboard shows 847 CPU metrics. The alert fired—but is the problem in us-east or us-west? You're trying to rule out whether that new feature caused a latency spike, but the sheer number of time series isn’t helping. Grouping can make this manageable. By organizing metrics by shared label values, you can quickly spot which service or region is behaving differently, without digging through every metric.

Instrument LangChain and LangGraph Apps with OpenTelemetry

In our previous blog, we talked about how LangChain and LangGraph help structure your agent’s behavior. But structure isn’t the same as visibility. This one’s about fixing that. Not with more logs. Not with generic dashboards. You need to see what your agent did, step by step, tool by tool, so you can understand how a simple query turned into a long, expensive run.