Operations | Monitoring | ITSM | DevOps | Cloud

Grafana Loki sneak peek: Generate Ad-hoc metrics from your NGINX Logs

Get a sneak preview of a future version of Grafana Loki that enables you to generate ad-hoc metrics from your log data. This video features a Loki-based web analytics dashboard, which uses the access logs of the popular open-source web server NGINX. Every panel on this dashboard uses ad-hoc metrics created with Loki, well, besides the Log panel obviously. Would this be useful for your use-case? Let us know in the comments.
New Enterprise features in Grafana 7.0: Usage insights and user presence indicator

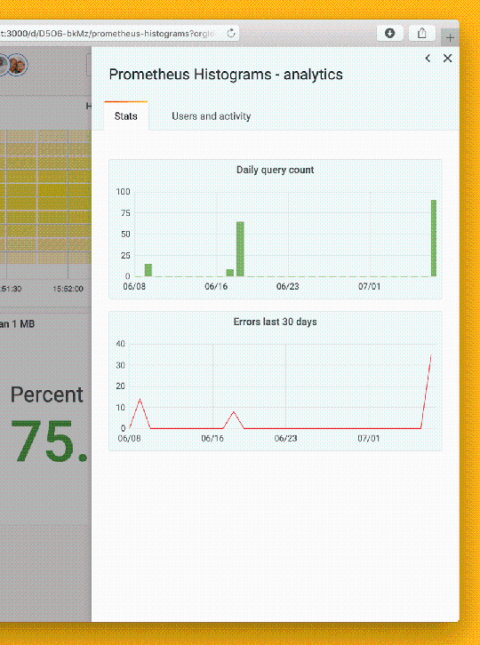
Dashboard sprawl is a real problem whether you’re using Grafana or any other tool. When growing to thousands of users – and as many dashboards – you’ll eventually want more information about how the tool is being used in your organization. After all, dashboards don’t help anyone if they aren’t being used. Managing large installations is one of the areas where Grafana Enterprise improves Grafana, and our launch of usage insights in 7.0 is a key part of that.

Getting started with the Grafana Cloud Agent, a remote_write-focused Prometheus agent

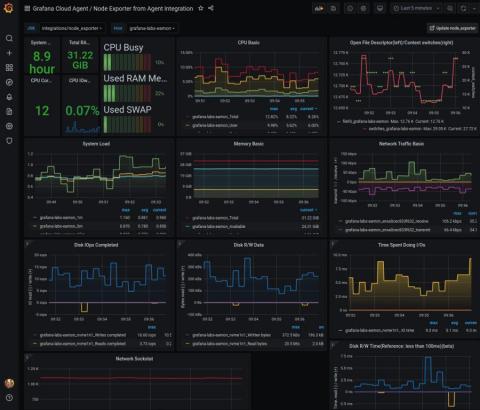
Hi folks! Éamon here. I’m a recent-ish addition to the Solutions Engineering team and just getting my feet wet on the blogging side so bear with me. :) Back in March, we introduced the Grafana Cloud Agent, a remote_write-focused Prometheus agent. The Grafana Cloud Agent is a subset of Prometheus without any querying or local storage, using the same service discovery, relabeling, WAL, and remote_write code found in Prometheus.

Why optimizing for MTTR over MTBF is better for business

The classic debate when running a software as a service (SaaS) business is between release frequency vs. stability and availability. In other words, are you Team MTTR (mean time to recovery) or Team MTBF (mean time between failure)? In this blog post, I argue for MTTR, which encourages you to push more frequently, embrace the instability this may introduce, and invest in training and tooling to deal with the pursuing outages.

Getting Started with Grafana Webinar

In this webinar, Marcus will show you how to get started using Grafana. He’ll walk you through the Grafana user interface while showing how to set up monitoring for a web service that uses Prometheus and Loki to store metrics and logs. You’ll learn how to connect, explore, and correlate data in Grafana to gain valuable insights into your application. This webinar requires no previous experience with Grafana.

Monitoring Java applications with the Prometheus JMX exporter and Grafana

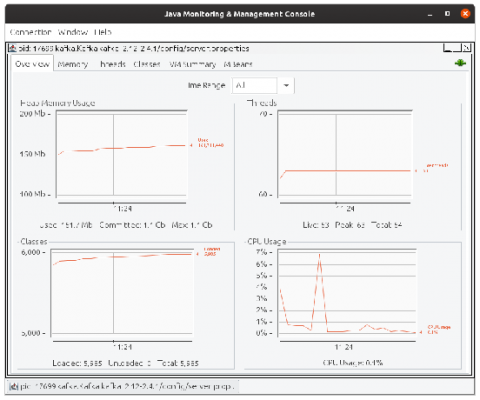
We all know that Prometheus is a popular system for collecting and querying metrics, especially in the cloud native world of Kubernetes and ephemeral instances. But people forget that Java has been running enterprise software since 1995, while Prometheus is a relative newcomer to the scene. It was only created in 2012! Even though Java has had its own metric collectors since before Prometheus was born, none of our new environments speak its (metric) language. How can you bridge that gap?

Learn Grafana: How to build a scatter plot plugin in Grafana 7.0

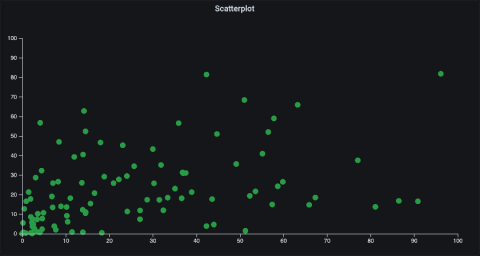
There are a lot of great things about Grafana 7.0, but one of my favorite features is the new React-based plugin platform, which has a set of new APIs and design system to help you build your own plugin. The process is easier and faster than ever. In this blog post, I’ll show how you can create a panel plugin for visualizing scatter plots. A scatter plot is a type of graph that displays values for (usually) two variables as a set of points along a horizontal and vertical axis.

How to visualize Prometheus histograms in Grafana

Do you have a Prometheus histogram and have you asked yourself how to visualize that histogram in Grafana? You’re not alone. Here, we will show you how it’s done. This post assumes you already have a basic understanding of Prometheus and Grafana and it will look at Prometheus histograms from the perspective of Grafana 7.0.

Migrating Grafana's template variables from AngularJS to React: A tale of failures and wins

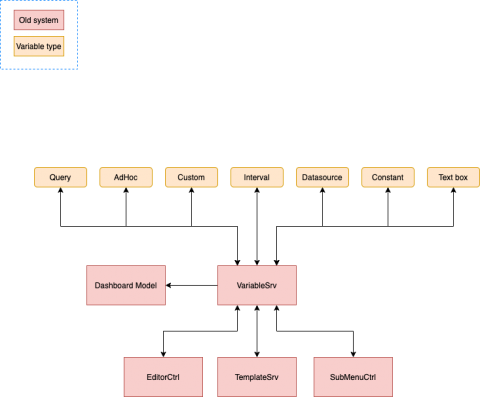
As many of you already know, we created Grafana using AngularJS, but we have been migrating to React for about two years now. One of the big missing pieces in our migration puzzle was the templating system. This post starts in late 2019 when I first got my hands on this mysterious and complex area of the Grafana code base.

How Grafana Labs enables horizontally scalable tail sampling in the OpenTelemetry Collector

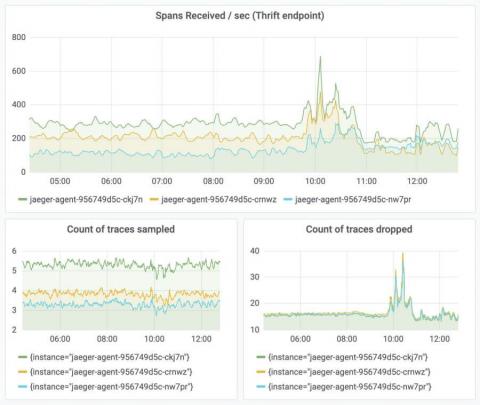
Tracing is a widely adopted solution to provide performance insights into distributed applications. It is a valuable resource for developers to view the service call graph and track service latency at a granular level. It’s also a handy tool for on-call engineers to drill down and debug a problematic service during an outage. There are a number of open source distributed tracing frameworks out in the wild, including Jaeger, Zipkin, and OpenTelemetry.