Operations | Monitoring | ITSM | DevOps | Cloud

How Datadog defines service criticality at scale

Datadog runs thousands of internal services and has been increasing global footprint year after year. For most of that growth, we treated services uniformly when making deployment and reliability decisions. At our current scale, that approach became expensive. A change destined for production rolls out to data centers sequentially, so deployment time grows with every data center we add.
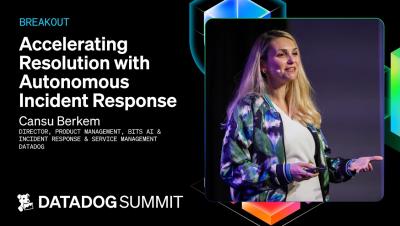
Accelerating Resolution with Autonomous Incident Response v1

Incident response often spans a patchwork of tools, handoffs, and manual steps. An engineer gets paged, a team investigates the issue, the incident commander coordinates the response, SREs document decisions, and somebody (anybody!) writes the postmortem. Every handoff introduces more context switching, increasing the risk of critical information loss, and ultimately slowing resolution.

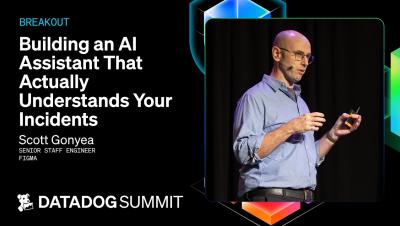
Building an AI Assistant That Actually Understands Your Incidents

When production breaks, the clues are everywhere but the story is scattered. RUM sessions, APM traces, metrics, and logs allow Datadog to tell you part of the story. What’s missing is your service ownership quirks, your team's conventions, or the three-year-old workaround buried in a comment that explains why a certain endpoint behaves the way it does.

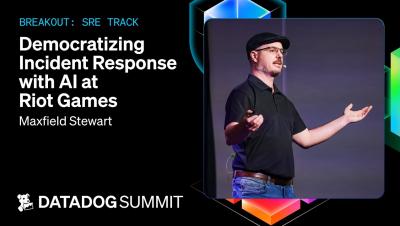
Democratizing Incident Response with AI at Riot Games - SRE Track

Senior engineers are the pillars of SRE programs—not only do they have the leadership to manage incidents well, they also have the tribal knowledge to understand the technical causes of tricky issues. But when the know-how is confined to a few individuals, it greatly limits the effectiveness of your SRE team.

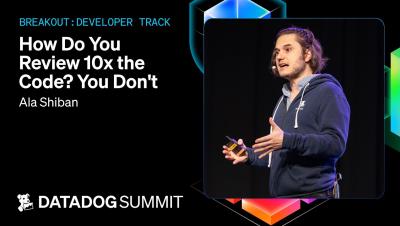
How Do You Review 10x the Code? You Don't - Developer Track

AI is generating code at 10x human speed, but we’re not shipping software 10x faster. Agents have a quality problem, and we still can’t trust their output without validation. Breaking the code review model didn’t help. So what would it take to autonomously ship code that’s actually trustworthy? Join us to explore what an agentic harness looks like when the SDLC is the harness, a validation system that spans intent, CI, staging, and production, with context flowing bidirectionally between all stages.

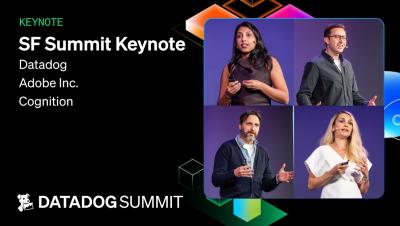
Datadog San Francisco Summit: Keynote

Datadog has always been driven by a broader vision of helping teams understand and operate complex systems. In this session, you'll hear from Michael Whetten, Senior Vice President of Product Management, and Cansu Berkem, Director of Product Management, as they share the latest updates across the Datadog product suite and discuss how that vision continues to shape the platform's evolution and support the next generation of AI-driven applications.

Unify data across Datadog BYOC with cross-cluster queries for teams and AI agents

Organizations may need to keep data in specific regions or infrastructure they control, whether because of data residency requirements, internal policies, or transfer costs. Datadog Bring Your Own Cloud (BYOC) extends the Datadog platform into those environments. Each BYOC deployment runs as a Kubernetes cluster with its own object storage, keeping data close to its source.

Define user actions on your web app with visual labeling in Product Analytics

Adding or renaming a product event has traditionally meant creating an engineering ticket. Datadog Product Analytics uses the same SDKs and configuration as Real User Monitoring (RUM), and those SDKs autocapture actions such as clicks and taps. But an automatically generated action name describes the element rather than the user intent behind it.

Run incident response in your FedRAMP High environment

Earlier this year, Datadog for Government achieved FedRAMP High certification, extending our GovCloud environment (US1-FED) to the federal government’s most sensitive civilian workloads. That certification now covers Datadog Incident Response, bringing paging, incident coordination, automation, and postmortem workflows into US1-FED. When a government system goes down, responders need to reach the right people, coordinate a fix, and keep stakeholders informed.

Ship faster, improve reliability, and control CI costs with Datadog CI/CD Optimization

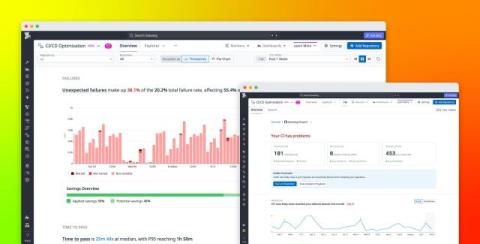
AI-assisted development can increase the rate at which teams produce code, but teams only realize those velocity gains if CI can keep pace. More pull requests (PRs) mean more builds, tests, and pipeline executions. Slow jobs leave developers and coding agents waiting for feedback, flaky failures consume time in reruns and investigations, and unnecessary test execution increases runner demand as delivery volume grows.

Monitor Databricks with Datadog

Earlier in this series, we covered key metrics for monitoring performance in Databricks and discussed Databricks’ native resources for accessing those metrics and other key observability data, such as logs and data lineage. In this post, we’ll cover using the Databricks integration to bring that data into Datadog and monitor your Databricks analytics and AI/ML workloads alongside the rest of your end-to-end data pipelines and distributed infrastructure. We’ll show you how to.

Databricks' native monitoring resources

In the first part of this series, we cataloged key metrics for Databricks data engineering, analytics, and Model Serving workloads. In this post, we’ll discuss how to collect those metrics and other telemetry data from Databricks and Apache Spark, which powers Databricks under the hood. We’ll cover collecting and querying telemetry data via system tables, as well as the other primary sources of visibility into.

Monitor warehouse data quality beyond pipeline health

You get a Slack message from the VP of Sales: They have asked an AI agent connected to Snowflake for the past quarter’s revenue and the numbers look wrong. First, you verify the agent’s query and, when that looks fine, check the pipelines that populate the underlying table. All jobs completed, the data is recently refreshed. Then it’s time to check the logs for errors. Nothing.