Operations | Monitoring | ITSM | DevOps | Cloud

PagerDuty Status Pages Enable Real-Time, Proactive Customer Communication During Incidents

Integrated, Intuitive Feature Saves Time and Money, Aligning Technical and Customer-Facing Teams, Allowing Further Consolidation on to the PagerDuty Platform, and Building Customer Trust During Large-Scale Events.
SUSE Receives 15 Badges in the Winter G2 Report Across its Product Portfolio

I’m pleased to share that G2, the world’s largest and most trusted tech marketplace, has recognized our solutions in its 2023 Winter Report. We received a total of 15 badges across our business units for Rancher, SUSE Linux Enterprise Server (SLES), SLE Desktop and SLE Real Time – including the Users Love Us badge for all products – as well as three badges for the openSUSE community with Leap and Tumbleweed.

Catchpoint Announces the World's First Complete Solution to Monitor and Protect the Internet's Leading Companies from BGP Incidents in Seconds

Catchpoint's Internet Performance Monitoring Platform helps IT teams identify and mitigate BGP incidents, including hijack attempts and routing issues, with the industry's broadest network of vantage points in the world drawing on real-time BGP monitoring.

Introducing PagerDuty Status Pages for Improved Customer Communication and Savings

In 2023, the fight to retain customers will be one of the biggest factors determining whether a business can survive the recession all are predicting. One of the key findings from the 2022 State of Service Report from Salesforce is that great service is at the heart of customer retention: 48% of customers will switch brands for better customer service when something goes wrong, and they view open communication as a key factor in how a customer might gauge the quality of customer service.

Azure Managed Grafana users can now upgrade to Grafana Enterprise

In November 2021, we announced a strategic partnership with Microsoft to develop a Microsoft Azure managed service that lets customers run Grafana natively within their Azure cloud platform. Azure Managed Grafana, which became generally available in August 2022, makes it simple for Azure customers to deploy secure and scalable Grafana instances and connect to open source, cloud, and third-party data sources for visualization and analysis.

Introducing easy custom event monitoring for serverless applications.

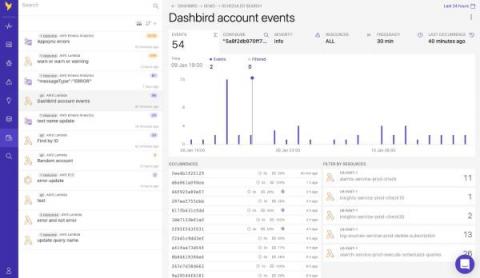
Today we are excited to announce scheduled searches – a new feature on Dashbird that allows you to track any log event across your stack, turn it into time-series metric and also configure alert notifications based on it. This has been one of the most requested features across our users and we are thrilled to make it available for all users starting today.

Elastic Enterprise Search 8.6: Reduce time to relevant search results - for file systems, MongoDB, and Amazon S3

Elastic Enterprise Search 8.6 enables customers to index searchable content on file systems, network drives, MongoDB, and Amazon S3. With new connectors for network drives and Amazon S3, content indexed can easily be transformed for natural language processing (NLP) use cases with intuitive tooling to test and tune your search experience with the trained model of your choice.

Elastic Observability 8.6: Maximizing operational efficiencies with improved application analysis and workflow integrations

Elastic Observability 8.6 introduces a set of capabilities improving production operations through the introduction of host (EC2/GCP compute/Azure compute) observability, application dependency operations views (insights into databases, caches, etc), and a new connector for Opsgenie. These new features allow customers to: Elastic Observability 8.6 is available now on Elastic Cloud — the only hosted Elasticsearch offering to include all of the new features in this latest release.

4 New AWS Monitoring Dashboards for EC2, EBS, RDS and S3

This is just a quick blog to draw attention to some new and enhanced monitoring dashboards we have added to eG Enterprise in the upcoming release (v 7.2) to provide quick and powerful overviews of a range of AWS services. As with all our dashboards, color-coded overlays provide guided drilldown for help desk operators and administrators. If a component has an issue, an amber or red indicator is overlaid to allow the viewer to click through to further diagnostic information.