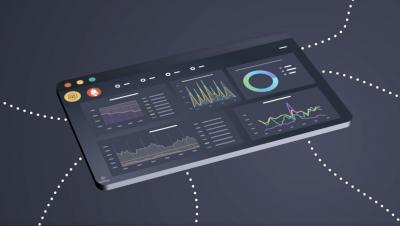
In a previous post I explained how to send metrics to Logz.io Infrastructure monitoring with Prometheus—now let’s analyze them by building Prometheus dashboards and visualizations in our metrics UI! Once you’ve started to send metric data to Logz.io, how do you visualize and interpret that data so that it’s useful for you? Logz.io Infrastructure Monitoring provides powerful querying and visualization of your data.
This Logz.io Infrastructure Monitoring tutorial will cover how to get started with our latest product, our new Prometheus-as-a-Service metrics solution that’s based on Prometheus. Engineers monitor metrics to understand CPU and memory utilization for infrastructure, duration and serverless execution, or for network traffic. For more advanced metrics monitoring operations, teams can send custom metrics to monitor signals like the number of active users.
Today, Logz.io is thrilled to announce that Prometheus-as-a-service is now generally available for anyone to try themselves! I’d like to thank the Logz.io village for executing a huge milestone on our quest to unify the best open source monitoring tools on Logz.io’s scalable cloud platform.
Sifting data can be fun for some people. Connecting the dots and finding correlations where they weren’t obvious before. It’s the crux of what drives people’s motivation in data science. It’s no different in any other field, especially in one involving systems observability, telemetry, or monitoring. And the best way to do that is to develop a fluency with query languages for different database structures and open source tools.
The Logz.io Cloud SIEM team is excited to announce a new free trial! You’ll be able to ship 1 GB of security events per day for 21 days. Cloud SIEM makes it easy to centralize, prioritize, and investigate security events, so you can respond to threats faster than ever. Check out this short demo video to see how it works. Sound interesting? Check out the instructions for our 21 day free trial below!
Microsoft recently announced a campaign by a sophisticated nation-state threat actor, operating from China, to exploit a collection of 0-day vulnerabilities in Microsoft Exchange and exfiltrate customer data. They’re calling the previously unknown hacking gang Hafnium. Microsoft has apparently been aware of Hafnium for a while — they do describe the group’s historical targets.
Logz.io has always prided itself as a company pushing the use of open source tech. As we have moved to expand our reach with metrics and traces over the past year and a half, we have doubled down on our own contributions to the community. With (distributed) traces in particular, we have been able to forge ahead. Our relationship with the teams at Jaeger and OpenTelemetry have really blossomed (and we are kind of proud to have supported the latter in the run-up to the OpenTelemetry v1.0 release).