Operations | Monitoring | ITSM | DevOps | Cloud

How to visualize CSV data with Grafana

While CSV data is often associated with popular spreadsheet apps like Google Sheets or Microsoft Excel, Grafana offers a number of capabilities to quickly visualize and analyze data stored in a CSV format. In this post, we’ll walk through an example of how to use Grafana to visualize any CSV file from anywhere on the web. More specifically, we will: Moving forward, you can also apply these steps to build any kind of dashboard within Grafana.

SLOs: a guide to setting and benefiting from service level objectives

If you’re running a technology-driven business, reliability isn’t optional—it’s essential. But how do you balance speed and innovation with a level of reliability that satisfies your customers? That’s where service level objectives (SLOs) come in. SLOs offer a framework for defining and achieving reliability goals, aligning technical efforts with user needs, and driving meaningful outcomes for your business.

How to integrate performance testing and continuous profiling for deeper application insights

A key goal of performance testing is to ensure your applications perform well under various levels of load. While critical, these tests are often conducted with minimal insight into why a system performs a certain way during testing. Metrics, logs, and traces may tell part of the story, but can miss the deeper details. This is where continuous profiling comes in.

Grafana 11.5 release: easily share Grafana dashboards and panels, secure frontend code for plugins, and more

New year, new Grafana release! Grafana 11.5 is here with new features to enhance how you can share, migrate, and alert on all your data in Grafana. Grafana 11.5: Download now Below are just some of the highlights from the latest Grafana release. If you are looking for more details about all the changes in this release, refer to the changelog or the What’s New documentation.

How to migrate to Grafana IRM: find the right path for your organization

Hundreds of organizations have migrated from legacy incident response tools to Grafana IRM in recent years as they look to improve production reliability, reduce costs, and consolidate their tooling. Grafana IRM, our incident response and management product, has helped organizations such as LATAM Airlines simplify stressful incidents with observability-native workflows, but every organization has its reservations about the actual migration process.

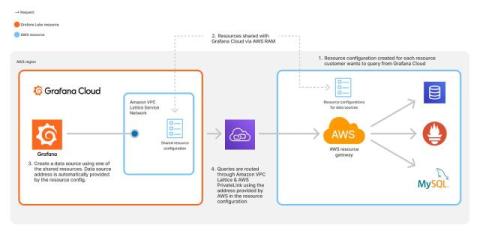
Databases and SLOs: How to apply service level objectives to your databases with synthetic monitoring

Wilfried Roset is an engineering manager who leads an SRE team and he is a Grafana Champion. Wilfried focuses on prioritizing sustainability, resilience, and industrialization to guarantee customers satisfaction. Nowadays databases are commonly used to build information systems. Relational or NoSQL, self-managed or as-a-service, those databases often play a critical role in the overall health of your applications.

Kubernetes Monitoring Helm chart 2.0: a simpler, more predictable experience

The Kubernetes Monitoring Helm chart 2.0 is here, and it comes with some exciting changes to improve your experience collecting observability data. The Kubernetes Monitoring Helm chart makes it easy to start gathering telemetry data from your Kubernetes clusters. With one deployment, you can capture all of the metrics, logs, traces, and profiles from your cluster and the applications running on it!

Grafana Cloud updates: tools to streamline performance testing, a new Adaptive Logs feature, and more

We consistently roll out helpful updates and fun features in Grafana Cloud, our fully managed observability platform powered by the open source Grafana LGTM Stack (Loki for logs, Grafana for visualization, Tempo for traces, and Mimir for metrics). In case you missed them, here’s our monthly round-up (the first of 2025!) of the latest and greatest Grafana Cloud updates. You can also read about all the features we add to Grafana Cloud in our What’s New in Grafana Cloud documentation.

Demystifying the OpenTelemetry Operator: Observing Kubernetes applications without writing code

The promise of observing your application without writing code (i.e., auto-instrumentation) is not new, and it’s extremely compelling: run a single command in your cluster and suddenly application telemetry starts arriving at your observability backend. What else could you ask for? The OpenTelemetry Operator aims to fulfill such a dream for Kubernetes environments by using a set of well known patterns such as operators and custom resources.