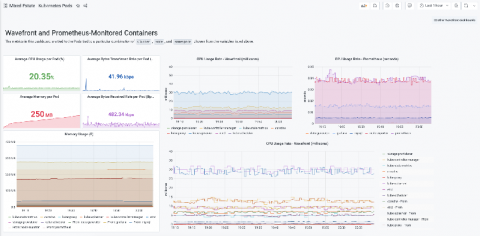
The new Wavefront Enterprise plugin brings the high-scale, high-speed SaaS to your Grafana dashboards
In early 2020, the Wavefront team was merged into the newly formed “Tanzu” portfolio under VMware’s Modern Applications business unit.


In early 2020, the Wavefront team was merged into the newly formed “Tanzu” portfolio under VMware’s Modern Applications business unit.
Often there’s a focus on how a service is running from the perspective of the organization. But what does service health monitoring look like from the perspective of a user? Today, understanding your end users’ experience is a key component of ensuring your website or application is functioning correctly. Having a website that is performing well regardless of location, load, or connection type is no longer a nice-to-have, but rather a requirement.
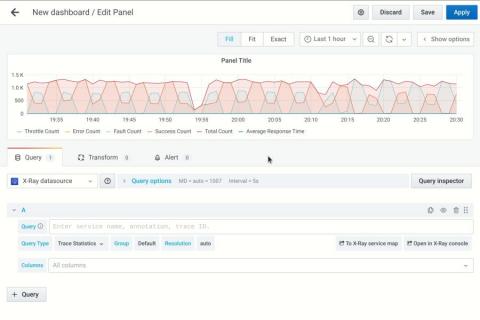
In collaboration with the AWS team, we have just launched another AWS integration, the X-ray data source. Combined with the CloudWatch and Timestream integrations, the AWS X-Ray data source simplifies monitoring and triaging with one Grafana console. The addition of the AWS X-ray data source reflects Grafana’s commitment to becoming a full observability platform that supports distributed tracing as well as metrics and logs.
Greetings! This is Eldin reporting from the Solutions Engineering team at Grafana Labs. In previous posts, you might have read about announcing ObservabilityCON or our release of Grafana 7.2. In this week’s post, I am introducing Dave Frankel, who will be covering our updated ServiceNow plugin. – Eldin In a previous post we announced the release of our Enterprise ServiceNow plugin. Our first release was focused around incident and change management based on the feedback we received.
Today, AWS launched Amazon Timestream, a fast, scalable, serverless time series database purpose-built for IoT use cases. If you’re looking into trying out Timestream, know that you can visualize the native Timestream queries with Grafana out of the box. Here are some examples of the robust, SQL-style Timestream queries visualized in Grafana.
What range should I use with rate()? That’s not only the title of a true classic among the many useful Robust Perception blog posts; it’s also one of the most frequently asked questions when it comes to PromQL, the Prometheus query language. I made it the main topic of my talk at GrafanaCONline 2020, which I invite you to watch if you haven’t already. Let’s break the good news first: Grafana 7.2, released only last Wednesday, introduced a new variable called $__rate_interval.
My name is Jonathan Stines, and I am a Penetration Tester for Rapid7, a cybersecurity company located in Austin, Texas. A small handful of my former colleagues at Rapid7 now work at Grafana Labs and have said it was a pretty cool spot to have landed. I had a vague understanding of what Grafana was, but what really struck my interest was when I saw their sweet dashboards in the HBO series Silicon Valley.
The 7.2 stable release builds on the major developments in Grafana 7.0. Interested in getting started with Grafana? Watch this webinar for a demo of the user interface and setup.
First of all, we’re pleased to announce the first release of the GitHub data source. The source code is available at github.com/grafana/github-datasource. Contributions, feature requests, and bug reports are welcome. Using the GitHub data source, Grafana users can visualize data from GitHub’s API. In this blog, we’ll go over some use cases for this handy plugin.
Today, we announced the launch of a new Grafana Labs product: Grafana Metrics Enterprise, a scalable Prometheus-compatible service designed for large organizations that is seamless to use and simple to maintain. Over the past few years, Prometheus has risen in popularity to become the de facto monitoring system for the cloud native ecosystem around Kubernetes — and for good reason.